Download
1 / 19
190 likes | 537 Vues
Science applications of high resolution water level observations Water level is a key remotely sensed observation of the momentum equation Mobile Bay Apalachicola River MS Delta South West Pass Science applications of high resolution water level observations Mesoscale energy

E N D
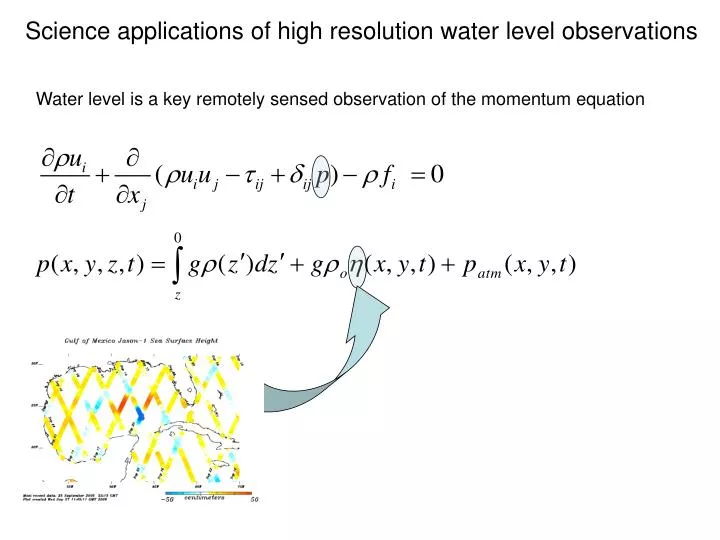
Science applications of high resolution water level observations Water level is a key remotely sensed observation of the momentum equation
Mobile Bay Apalachicola River MS Delta South West Pass Science applications of high resolution water level observations Mesoscale energy Tide and wind-driven inundation River effects on optical properties Surface wave dissipation
50 m 150 m 500 m 1000 m Do we have sufficient observations to determine energy exchange between the surface and deep water? • 1/25° resolution Gulf of Mexico • Assimilated Jason-1, ENVISAT, GFO • Color is surface height • Vectors are 500m currents • Baroclinic shear exchanges potential and kinetic energy between deep and surface waters • 14 Acoustic doppler current profilers deployed May 2004 – March 2005 -40 (cm) 40 Hogan and Zamudio, work under way
Correlation of along-shelfbreak currents NOGAPS, Assim NOGAPS, Assim 2 Hogan and Zamudio, work under way
Correlation of along-shelfbreak currents NOGAPS, Assim NOGAPS, Assim 2 A1/A2 Hogan and Zamudio, work under way
Mobile Bay Apalachicola River MS Delta South West Pass Science applications of high resolution water level observations Mesoscale energy Tide and wind-driven inundation River effects on biology and optical properties Surface wave dissipation
Are there sufficient observations to understand inundation physics? Hurricane Katrina Strom Surge/Inundation Along The Mississippi Gulf Coast Bay St. Louis feet Several months of work to get this. Why? Blain and Massey, Marine Tech., submitted 2006
Model (red), Observations (black) High Water Mark (ft) Mean Abs error = 3.07 ft Mean Underprediction = 2.32 ft Mean Overprediction = 3.45 ft Longitude (deg) Many physical processes influence results • Wind forcing • Bottom drag (flat land, grass, shrubs, trees, houses, …) • Morphological changes Comparison to 27 USGS High Water Mark Locations Topography (Land +, Water -) in feet Blain and Massey, Marine Tech., submitted 2006
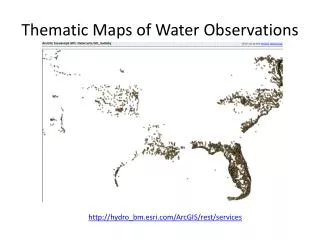
Observations through tide cycles are required to understand and test the relevant physics Water line observed from visible imagery Ebb Tide Flood Tide Dry areas appear gray MODIS (250 m) White lines show coastline from a global database. Massey, work under way, 2006
Mobile Bay Apalachicola River MS Delta South West Pass Science applications of high resolution water level observations Mesoscale energy Tide and wind-driven inundation River effects on biology and optical properties Surface wave dissipation
Correlation between optical absorption and Mississippi River discharge Chlorophyll absorption CDOM absorption • Monthly composite images over 2000-2004 • Monthly averaged observed river outflow Green et al., Montreal, 2006
MODIS 250 Discharge event, March 17-23, 2004 Blain et al., RSCME meeting, Hallifax, 2006
m/s 0.50 0.45 0.40 0.35 0.30 0.25 0.20 0.15 0.10 0.05 0.00 River discharge and local circulation are required to predict particle fate MAR 17 MAR 19 MAR 21 Current Magnitude (Tides+ Winds + River Forcing) 1 particle every hour Blain et al., RSCME meeting, Hallifax, 2006
Mobile Bay Apalachicola River MS Delta South West Pass Science applications of high resolution water level observations Mesoscale energy Tide and wind-driven inundation River effects on biology and optical properties Surface wave dissipation
Do we have sufficient observations to determine wave energy dissipation mechanisms nearshore? P4 P3 P2 P1 • Pressure gauges along transect to beach • Wave rider buoy for boundary conditions Rogers et al., work under way, 2006
Pressure gauge spectra at p4 with and without fluid mud layer dissipation (Ng, 1974 formulation) Wave rider buoy wavenumber spectrum Energy spectrum at P4, near shore Rogers et al., work under way, 2006
Wave rider buoy wavenumber spectrum • Possible dissipation : • Fluid mud layer • Form drag from sand ripples • Wave energy matches observations with two possible mechanisms, though insufficient information to separate the two • Additional areas must be observed and theory tested Bathymetry along transect Integrated spectral energy Integrated spectral energy Distance from shore (km) Rogers et al., work under way, 2006
Mobile Bay Apalachicola River MS Delta South West Pass Science applications of high resolution water level observations Mesoscale energy Tide and wind-driven inundation River effects on biology and optical properties Surface wave dissipation