Download
1 / 18
180 likes | 279 Vues
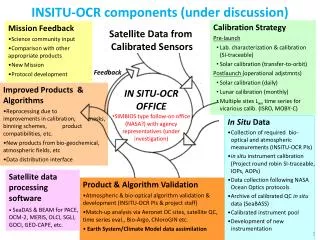
Explore a methodology to align growth seasons from satellite data for classifying mountain vegetation in Norway.

E N D
Alignment of Growth Seasons from Satellite Data Ragnar Bang Huseby, Lars Aurdal, Dagrun Vikhamar, Line Eikvil, Anne Solberg, Rune Solberg
What? Determine the correspondence between the chronological time of the image acquisition and the time at which the phenological state of the vegetation cover shown in the image would typically occur. ? ? Landsat image
Why? The work is motivated by a high mountain vegetation classification problem in Norway. Vegetation classes are characterized by their temporal evolution through a growth season. Data of high spatial resolution are often temporally sparse. In order to get a longer sequence of images, data from different years should be combined into one single synthetic sequence.
Combining image data July 24th 1994 June 25th 1995 August 19th 1995 June 5th 1997 August 17th 1998 July 29th 1999 October 18th 1999 May 19th 2002 May 23rd 2004 May 19th May 23rd June 5th June 25th July 24th July 29th August 17th August 19th October 18th Naive approach
Problems with naive approach... May 23rd 2004 June 5th 1997
How? NDVI = The normalized difference vegetation index Extract the maximum NDVI from the region of interest.
NDVI in various growth seasons alignment of growth seasons = alignment of NDVI curves
Model of observations is the time warping function. is the remainder not explained by the model. is the expected NDVI as a function of phenological ”time”.
Double logistic function The parameters can be estimated from data from a given year.
Time warping functions Early spring Normal spring Late spring
Minimization problem We wish to determine the warping function . The discrepancy between model and observations should be small. Minimizing this object function produces weird results.
Object function measures the deviation between and 1. measures the deviation between and 1. measures the deviation between and the identity. We wish to determine the warping function . The warping function minimizes the sum
Dynamic programming Discretize time Finite but huge number of feasible solutions Find optimal solution by dynamic programming Similar approaches have been used in speech recognition.
Experiments Dataset for time warping: Global Inventory Modeling and Mapping Studies (GIMMS) A sequence of NDVI composites extracted from NOAA AVHRR data from the period 1982 – 2003. 24 images from each year. In addition, MODIS data from 2003 and 2004. Test site: Region in Norway including mountain areas.
Images in correct order! Day 156, 1997 Day 144, 2004
Application The results from this study have been used in the work titled Classification of Multitemporal Satellite Images Using Phenological Models also a talk at MultiTemp 2005.
Conclusions We have proposed a methodology for alignment of growth seasons from satellite data. The proposed methodology has been tested on data from several years covering a region in Norway including mountain areas. The results show that it is possible to combine data from several years into a sequence of observations from one season. We expect that the methodology will serve as a useful tool in multi-temporal classification.