Download
1 / 57
570 likes | 770 Vues
PROBABILITY AND GOODNESS OF FIT:. Genetic ratios are most properly expressed as probabilities Ex ¾ tall ¼ short, which predict the outcome of each fertilization event, such as a zygote having the genetic potential to be tall.

E N D
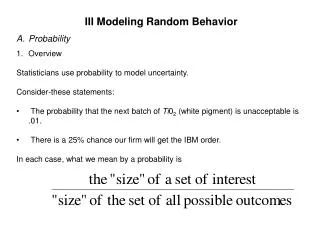
PROBABILITY AND GOODNESS OF FIT: • Genetic ratios are most properly expressed as probabilities Ex ¾ tall ¼ short, which predict the outcome of each fertilization event, such as a zygote having the genetic potential to be tall. • Probabilities range from 0, where an event is certain not to occur, to 1 where an event is certain to occur.
TWO INDEPENDENT, NONGENETIC EVENTS: • Product law : Holds that the probability of 2 independent events occurring simultaneously is the product of the event’s independent probability. • Sum law: Holds that the probability of one or the other of two mutually exclusive events occurring is the sum of the event’s individual probabilities.
Example: • If 2 coins are tossed simultaneously each having a ½ chance of heads and ½ tails the probability of 2 heads would be ¼, the probability of tails would be ¼ and the probability of one head and one tail would be (1/4 HT, ¼ TH) 1/2
IMPORTANT: Remember when dealing with probability, predictions of possible outcomes are usually realized only with large sample sizes. Any deviation from the predicted ratio in small sample sizes is attributed to chance. So if 2 coins are tossed for, say 50 tosses simple assumptions about the coins must first be made before probabilities are calculated: coins must be unbiased: constructed physically so that each coin has an equal chance of landing either head or tail Coin tosses are independent of each other: does each coin toss have an equal chance of coming to rest heads or tails. Successive tosses (events) are also independent of each other.
binomial theorem • The binomial theorem can be used to predict the likely outcome of such a number of coin tosses. • The binomial formula is: ( a + b)n = 1 • Example: In the 100 coin tosses, coins will either be heads or tails • Where: a = probability of a head for any coin = ½ • b= probability of a tail for any coin = ½ • n = 4 because 4 coins were tossed
Solution • So we get: ( a + b)4 = 1 • Expanded: a4 + 4a3b + 6 a2b2 + 4ab3 + b4 • Problem setup: (1/2)4 + 4[( ½)3 (1/2)] + 6[(1/2)2 (1/2)2] + 4[(1/2) (1/2)3] + (1/2)4 = 1 • So that: 1/16 + 4/16 + 6/16 + 4/16 + 1/16 = 1
GENETIC APPLICATION OF THE BINOMIAL • A man with ptsosis, whose father also displays the trait but whose mother did not, wishes to marry a woman with normal eyelids. They consult a physician to determine the likelihood of the occurrence of the defect in their children. • If they have 4 children, what is the probability of 3 of those being normal and 1 having ptosis?
Solution • MAN is heterozygous because he has ptosis but mother was normal…. So he is: Pp • The woman is normal so she is: pp • Parents (the man and woman above) are: Pp x pp • Gametes: P, p p, p • F1 Pp, Pp, pp, pp • The probability of a normal child is ½ and the probability for an afflicted child is ½ • So: a = probability of a normal child = ½ • b = probability of a child with ptosis = ½ • So: now use the expansion of the second term, 4a3b • 4(1/2)3 (1/2) = 4/16 = ¼ = .25 • This is used because it contains a3 (representing 3 children of the phenotype denoted by a) and b ( for one child o phenotype represented by b)
Results • There is a probability in this case of 1 in 4 or .25, that if they have four children, 3 will be normal and 1 will have ptosiss. There is a 1 chance in 16 (a4) or .0625, that non of the 4 will exhibit ptosis or (b4) that all 4 will have ptosis.
EXAMPLE #2: • A young man and woman, each of whom has ptosis and is heterozygous. If such a couple should marry and have 4 children, what is the probability of 3 being normal and one having ptosis?
Parents (couple): Pp x Pp • Gametes: P, p P, p • F1: PP, Pp, Pp, pp 3:1 ( ¾ having the condition) • Let : a = probability of a normal child = ¼ • b = probability of a child with ptosis = ¾
Solution • Because this case again concerns a family of 4 children, the binomial (a + b)4 would have been used. With the 2nd binomial expression used. • 4a3b = 4[(1/4)3 x (3/4)] = 12/256 • NOTE: Had the question been 2 normal and 2 afflicted children, the third term ( 6a2b2) would have been used.
Introduction Population = An interbreeding group of the same species in a given geographical area Gene pool = The collection of all alleles in the members of the population Population genetics = The study of the genetics of a population and how the alleles vary with time Gene Flow = Movement of alleles between populations when people migrate and mate
Allele Frequencies Allele frequency = # of particular allele Total # of alleles in the population Count both chromosomes of each individual Allele frequencies affect the genotype frequencies - The frequency of the two homozygotes and the heterozygote in the population
Frequency of a trait varies in different populations Phenotype Frequencies Table 14.1
Microevolution ( adaptation) The small genetic changes due to changing allelic frequencies in populations Five factors can change genotypic frequencies: 1) Nonrandom mating 2) Migration 3) Genetic drift 4) Mutation 5) Natural selection
Macroevolution Refers to the formation of new species
Hardy-Weinberg Equation Developed independently by an English mathematician and a German physician Used algebra to explain how allele frequencies predict genotypic and phenotypic frequencies in a population of diploid, sexually-reproducing species Disproved the assumption that dominant traits would become more common, while recessive traits would become rarer
Hardy-Weinberg Equation p = allele frequency of one allele q = allele frequency of a second allele All of the allele frequencies together equals 1 p + q = 1 All of the genotype frequencies together equals 1 p2 + 2pq + q2 = 1 p2 andq2 Frequencies for each homozygote 2pq Frequency for heterozygotes
Source of the Hardy-Weinberg Equation Figure 14.3 Figure 14.3
Solving a Problem Figure 14.4
Solving a Problem Figure 14.4
The allele and genotypic frequencies do not change from one generation to the next Thus, this gene is in Hardy-Weinberg equilibrium Table 14.2
Applying the Hardy-Weinberg Equation Used to determine carrier probability For autosomal recessive diseases, the homozygous recessive class is used to determine the frequency of alleles in a population - Its phenotype indicates its genotype Figure 14.3
Calculating the Carrier Frequency of an Autosomal Recessive Figure 14.5 Figure 14.3
Calculating the Carrier Frequency of an Autosomal Recessive Table 14.3
Calculating the Carrier Frequency of an Autosomal Recessive What is the probability that two unrelated Caucasians will have an affected child? Probability that both are carriers = 1/23 x 1/23 = 1/529 Probability that their child has CF = 1/4 Therefore, probability = 1/529 x 1/4 = 1/2,116 Figure 14.3
Calculating the Risk withX-linked Traits For females, the standard Hardy-Weinberg equation applies p2 + 2pq + q2 = 1 However, in males the allele frequency is the phenotypic frequency p + q= 1 Figure 14.3
Calculating the Risk withX-linked Traits Figure 14.6
HARDY-WEINBER THEREM is: • P2 + 2pq + q2 = 1 • frequency frequency frequency sum must equal • AA Aa aa 100%
EXAMPLE PROBLEM: • 1 in every 100 babies in USA is born with PKU resulting in mental retardation if untreated. • Allele for PKY is recessive, so babies with the disorder are homozygous = q2 • Thus q2 = .0001 ( 1/1000) with .01 = q (square root of .0001) • Frequency of p can be determined since p = 1-q • P= 1- .01 = .99 • Frequency of carriers (heterozygous ) in population is 2pq • 2pq = 2 (.99) (.01) = .0198 • Thus 2 % of USA population are carriers.
Hardy-Weinberg Equilibrium Hardy-Weinberg equilibrium is rare for protein-encoding genes that affect the phenotype However, it does apply to portions of the genome that do not affect phenotype These include repeated DNA segments - Not subject to natural selection
CONDITIONAL PROBABILITY: • Sometimes we may wish to calculate the probability of an event or outcome that is dependent on a specific condition related to that outcome. • Example: in the F2 generation of a monohybrid cross involving tall and dwarf plants, what would the probability be that a tall plant is heterozygous? • The condition we set is to consider only tall F2 offspring since we know that all dwarf plants are homozygous. • Of any F2 tall plant, what is the probability of it being heterozygous?
Conditional Probability Pedigrees and Punnett squares apply Mendel’s laws to predict the recurrence risks of inherited conditions Example: - Taneesha’s brother Deshawn has sickle cell anemia, an autosomal recessive disease. - What is the probability that Taneesha’s child inherits the sickle cell anemia allele from her?
Because the outcome and specific condition are not independent, we cannot apply the product law of probability….Instead we use conditional probability. • Conditional probability deals with the probability of one out come occurring, given the specific condition upon which this outcome depends.
X Taneesha and Deshawn’s parents must be heterozygous Taneesha is not affected and cannot be ss Probability Taneesha is a carrier = 2/3 Probabilitychild inherits sickle cell allele = 1/2 Probabilitychild carries sickle cell allele from her = 2/3 x 1/2 = 1/3
DNA Repeats Short repeated segments are distributed all over the genome The repeat numbers can be considered alleles and used to classify individuals Two types of repeats are important - Variable number of tandem repeats (VNTRs) - Short tandem repeats (STRs)
DNA Profiling A technique that detects differences in repeat copy number Calculates the probability that certain combinations can occur in two sources of DNA by chance DNA evidence is more often valuable in excluding a suspect - Should be considered along with other types of evidence
Comparing DNA Repeats Figure 14.7 Figure 14.7
DNA Profiling Developed in the 1980s by British geneticist Sir Alec Jeffreys Also called DNA fingerprinting Identifies individuals Used in forensics, agriculture, paternity testing, and historical investigations
Differing number of copies of the same repeat migrate at different speeds on a gel Figure 14.8 Figure 14.8
Jeffreys used his technique to demonstrate that Dolly was truly a clone of the 6-year old ewe that donated her nucleus Figure 14.9
DNA Profiling Technique 1) A blood sample is collected from suspect 2) White blood cells release DNA 3) Restriction enzymes cut DNA 4) Electrophoresis aligns fragments by size 5) Pattern of DNA fragments transferred to a nylon sheet
DNA Profiling Technique 6) Exposed to radioactive probes 7) Probes bind to DNA 8) Sheet placed against X ray film 9) Pattern of bands constitutes DNA profile 10) Identify individuals
DNA Fingerprinting Animation Please note that due to differing operating systems, some animations will not appear until the presentation is viewed in Presentation Mode (Slide Show view). You may see blank slides in the “Normal” or “Slide Sorter” views. All animations will appear after viewing in Presentation Mode and playing each animation. Most animations will require the latest version of the Flash Player, which is available at http://get.adobe.com/flashplayer. Figure 2.3
DNA Sources DNA can be obtained from any cell with a nucleus STRs are used when DNA is scarce If DNA is extremely damaged, mitochondrial DNA (mtDNA) is often used For forensics, the FBI developed the Combined DNA Index System (CODIS) - Uses 13 STRs
CODIS Figure 14.10 The probability that any two individuals have same thirteen markers is 1 in 250 trillion