The Climate Crisis
220 likes | 403 Vues
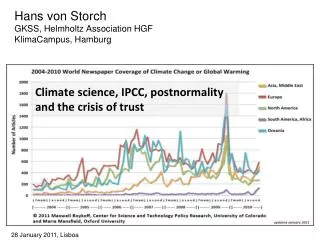
The Climate Crisis. Energy Emergency: Developing Trade Union Strategies 10 October 2012 395 Hudson Street, New York, NY. James Hansen. Global Warming Status 1. Knowledge Gap Between - What is Understood (scientists) - What is Known (public) 2. Planetary Emergency

The Climate Crisis
E N D
Presentation Transcript
The Climate Crisis Energy Emergency: Developing Trade Union Strategies 10 October 2012 395 Hudson Street, New York, NY James Hansen
Global Warming Status 1. Knowledge Gap Between - What is Understood (scientists) - What is Known (public) 2. Planetary Emergency - Climate Inertia Warming in Pipeline - Tipping Points Could Lose Control 3. Bad News & Good News - CO2 Already in Dangerous Zone - Multiple Benefits of Solution
Climate Tipping Points 1. Ice Sheet Disintegration - Ocean Warming Ice Shelves Melt Ice Streams Surge Disintegration 2. Species Extermination - Shifting Climate Zones, Multiple Stresses, Species Interdependencies 3. Methane Hydrate ‘frozen methane’ - In Tundra & On Continental Shelves - Depends On Ocean & Ice Sheets
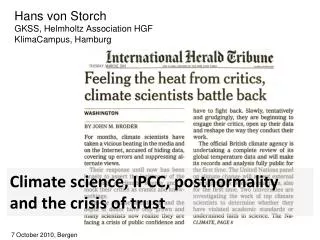
Left map: sea ice extent (>15% ice). Right: sea ice concentration (%). Purple line: climatologic extent (1979-2000). Data: 17 September 2012. Source: National Snow and Ice Data Center, Boulder, Colorado
Global temperature fluctuates, but the world is getting warmer Figure 1. Global surface temperature anomalies relative to 1951-1980 average for (a) annual and 5-year running means through 2010, and (b) 60-month and 132- month running means through July 2012. Green bars are 2-σ error estimates. (Hansen, J., Ruedy, R., Sato, M., and Lo, K., 2010: Global surface temperature change, Rev. Geophys. 48, RG4004.)
Earth’s energy imbalance: more energy coming in than going out ARGO floats have allowed accurate measurement of ocean heat gain since 2005. Earth is gaining energy at a rate 0.6 W/m2, which is 20 times greater than the rate of human energy use. That energy is equivalent to exploding 400,000 Hiroshima atomic bombs per day, 365 days per year.
Heat storage in upper 2000 meters of ocean during 2003-2008 based on ARGO data.Knowledge of Earth’s energy imbalance is improving rapidly as ARGO data lengthens. Data must be averaged over a decade because of El Nino/La Nina and solar variability.Energy imbalance is smoking gun for human-made increasing greenhouse effect.Data source: von Schuckmann et al. J. Geophys. Res.114, C09007, 2009, doi:10.1029/2008JC005237.
Earth’s energy imbalance, more energy in than out, was measured when the energy from the Sun reaching Earth was at its lowest level in the period of accurate data. This confirms that solar variability effects are overwhelmed by greenhouse gases. Solar energy reaching Earth; energy absorbed per m2 of Earth’s surface is ~240 W, so 0.1% solar variability is a climate forcing of almost 0.25 W/m2. (Update, through Aug. 2012, of Fig. 17 of Hansen et al., Atmos. Chem. Phys., 11, 13421-13449, 2011. Data through 2 Feb. 2011 is from Frohlich and Lean; more recent data from Univ. Colorado, SORCE experiment.)
Greenland Total Melt Area Area on Greenland with snowmelt. Graph credit: Konrad Steffen, Univ. Colorado
Gravity Satellite Ice Sheet Mass Measurements Greenland Ice Sheet Antarctic Ice Sheet Source: Velicogna, I. Geophys. Res. Lett., 36, L19503, doi:10.1029/2009GL040222, 2009.
Blue: Sea level change from tide-gauge data (Church J.A. and White N.J., Geophys. Res. Lett. 2006; 33: L01602) Red: Univ. Colorado sea level analyses in satellite era (http://www.columbia.edu/~mhs119/SeaLevel/).
Loaded Climate Dice: global warming is increasing extreme weather events. Extreme summer heat anomalies now cover about 10% of land area, up from 0.2%. This is based on observations, not models. Frequency of occurrence (vertical axis) of local June-July-August temperature anomalies (relative to 1951-1980 mean) for Northern Hemisphere land in units of local standard deviation (horizontal axis). Temperature anomalies in the period 1951-1980 match closely the normal distribution ("bell curve", shown in green), which is used to define cold (blue), typical (white) and hot (red) seasons, each with probability 33.3%. The distribution of anomalies has shifted to the right as a consequence of the global warming of the past three decades such that cool summers now cover only half of one side of a six-sided die, white covers one side, red covers four sides, and an extremely hot (red-brown) anomaly covers half of one side. Source: Hansen, J., Sato, M., and Ruedy, R., Proc. Natl. Acad. Sci., 2012.
Fires Are Increasing World-Wide Wildfires in Western US have increased 4-fold in 30 years. Western US area burned Source: Westerling et al. 2006
June 2011: Record 7.6% of U.S. in ‘Exceptional’ drought category, simultaneous with record flooding on Mississippi River.
50 million years ago (50 MYA) Earth was ice-free. Atmospheric CO2 amount was of the order of 1000 ppm 50 MYA. Atmospheric CO2 imbalance due to plate tectonics ~ 10-4 ppm per year.
Fig. 1. CO2 emissions by fossil fuels (1 ppm CO2 ~ 2.12 GtC).
What’s Really Happening 1. Tar Sands Agreement with Canada Pipeline planned to transport oil 2. New Coal-fired Power Plants Rationalized by ‘Clean Coal’ mirage 3. Mountaintop Removal Continues Diminishes wind potential of mountains 4. Oil & Gas Extraction Expands Arctic, offshore, public lands
Problem & Solution • Fossil Fuels are Cheapest Energy - Subsidized & Do Not Pay Costs - Solution: Rising Price on Carbon 2.Regulations also Required - Efficiency of Vehicles, Buildings,e.g. - Carbon Price Provides Enforcement 3.Technology Development Needed - Driven by Certainty of Carbon Price - Government Role Limited
Fee & Dividend Fee: Collected at Domestic Mine/Port of Entry Covers all Oil, Gas, Coal No Leakage Dividend: Equal Shares to All Legal Residents Not One Dime to the Government. Merits: Transparent. Market-based. Stimulates Innovation. Does Not Enlarge Government. Leaves Energy Decisions to Individuals. A Conservative Energy & Climate Plan.
Age of Risk – Or Opportunity Non-Linear Feedbacks Can Also Work for Us Rising Price on Carbon Spurs Innovation, Investment As Alternatives Become Cheaper Than Fossil Fuels Tipping Points Reached Rapid Phase-in of Clean Energy A Fork in the Road 1. BAU: Continued Addiction to Fossil Fuels Climate Spins Out of Control Due to Physical Tipping Points 2. Honest Rising Price on Carbon Emissions Rapid Transition to Clean Energy Future
Web Sites www.columbia.edu/~jeh1 www.CitizensClimateLobby.org