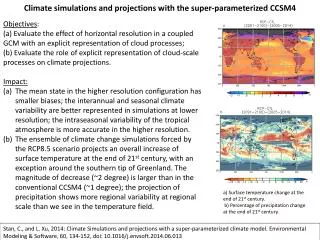
Nested Regional Climate Simulations with WRF: Assessing Tropical Scale Interactions
This study explores the implementation of the NCAR Weather Research and Forecasting Model (WRF) as a two-way nested regional climate model (NRCM). It assesses downscaling efforts over North America and current tropical-scale interaction analyses. The focus includes the importance of mesoscale convection organization, tropical cyclone development, and the regional impacts of climate modeling. The results showcase that while NRCM captures seasonal and geographical distributions of tropical cyclones, it tends to overproduce their frequency, indicating the need for continued refinement in model parameterizations.

Nested Regional Climate Simulations with WRF: Assessing Tropical Scale Interactions
E N D
Presentation Transcript
Nested Regional Climate Simulations with WRF Bill Kuo1 C. Bruyere1, J. Done1, G. Holland1, R. Leung2, Y. Liu1,3, S. Tulich1, A. Suzuki4 1. Mesoscale and Microscale Meteorology Division/NCAR, Boulder, CO 2. Pacific Northwest National Laboratory, Richland, Washington, Boulder, CO 3. Chinese Academy of Meteorological Science, Beijing 4. School of Earth and Atmospheric Sciences, Georgia Institute of Technology, Atlanta, GA
Approach and Current Focus Approach: Nesting the NCAR Weather Research and Forecasting Model into global/climate models as a 2-way Nested Regional Climate Model (NRCM); • Stage 1: Downscaling over North America (done); • Stage 2: 2-way atmospheric scale interactions in the tropics (current); • Stage 3: NRCM in CAM/CCSM, with coupled ocean model; as a community facility (to come) • Goal: a full global Weather/Climate system (longer term). Current Focus: Tropical scale interactions: • Importance of mesoscale organization of convection and its related surface exchanges and radiative influences for forcing tropical modes; • tropical cyclone development and intensification, tropical waves, East Asia monsoons
12 12 4 WRF-NRCM Simulations • “Bluevista run” • 1996-2000 • 30oS – 45oN • 34 levels, 50hPa TOA • “Columbia run” • 2000-2005 • 45oS – 45oN • 50 levels, 10hPa TOA • “2005 N. Atlantic run” • Forcing data: • NCEP/NCAR Reanalysis • AMIP monthly SST data • Model parameterization: • YSU boundary layer • Kain Fritsch convective parameterization
TC detection methodology • New storm detection • Find SLP local minima • |Max relative vorticity| > 5x10⁻⁵s-1 • Max wind speed > 18m/s • General wind pattern • Warm core • Pre-existing storm continuity • Distinctive SLP local minima within 20o of last storm location • Max wind speed > 18m/s • Warm core Updates storm location A storm satisfies continuity requirement for at least 48 hours • Check for overlaps in newly found storms and pre-existing storms • Check for merging of separate storms • “Eye-ball checks” Tropical Cyclone
Total TC count by year Columbia Bluevista • NRCM overproduced TCs (by about 25%) • SST setting? Model physics? Parameterization? Positive definite advection scheme?
“Bluevista run” (1996-2000, 30S-45N) 84 91 211 61 23 80 28 25 69 62 162 28 23 55 33 46
“Columbia run” (2000-2005, 45S-45N) 121 97 318 58 73 16 40 10 2 95 100 27 180 31 32 19 64
Southern boundary extension Blueviesta Columbia Bluevista boundary
Atlantic and Northwest Pacific 2005 is a particularly active year for observed hurricanes over the Atlantic. But, NRCM under-predicts the number of storms.
“2005 North Atlantic nested run” • May-Nov 2005 • 36km domain forced at Northern and Southern boundaries • 12km domain is nested over North Atlantic • 2-way nesting
Non-nested 36km 18 storms (+1 from E.Pac) Nested 36km 25 storms (+1 from E.Pac) Nested 12km 29 storms (+1 from E.Pac) 2005 N.Atl 28 storms actual
Impact of nesting to larger environment • 10 days running mean du/dz, 10o – 20oN average • du/dz is more favorable in the nested run
Nested (1DOM) vs. Non-nested (Columbia 2005 May-Nov) 15 24 3 38 0 1 1 1 37 17 6 17 0 1 1 2
Summary • The seasonal and geographical distribution of observed TC are well captured by NRCM in general. • NRCM overproduces number of TC by about 25%: • TC overproduction was enhanced in Columbia run over the western north Pacific. • TC genesis over the tropical N. Atlantic was not well captured. • Extending the southern boundary improved TC climatology in South Indian Ocean • Nesting improved 2005 North Atlantic TC statistics and distribution. The vertical wind shear is more favorable for genesis with the nested simulations. • Nesting changed TC counts over other regions, indicating that the impact of nesting can propagate to other regions.
The Problem: Tropical Modes Observed CCSM (Lin et al 2006) All tropical modes are poorly handled by current climate models. This impacts everything from tropical cyclones to ENSO and interactions with the extratropics.
NRCM vs. CLAUS (1997) CLAUS = Cloud Archive User Service, 3-hrly, Tb from multiple geostationary satellites
Conclusions • NRCM is fairly successful at capturing the propagation speeds and structures of convectively coupled Kelvin waves • Variance is significantly under-predicted over S. America, Africa, and the Indian Ocean, perhaps stemming from poor precipitation climatology
The Great Red Spot: Excessive rainfall
1996 1997 1998 1999 2000 2000 2001 2002 2003 2004 2005 OBS NRCM OBS NRCM
Why NRCM produces excessive rainfall in the pacific ocean in 1997? • In order to understand the problems associated with erroneous rainfall, we conducted a few sensitivity experiments: (1) Control run (2) Change Kain-Fritch cumulus scheme to Betts-Miller scheme. (3) Use explicit cloud microphysics without cumulus parameterization (4) Replace the 1997 SST by 1998 SST (5) Re-initialized NRCM at 1 May 1997 (cold start) With the cold start initial condition: (6) Add diurnal cycle into monthly SST (Zheng and Beljaars 2005) (7) Replace monthly SST by daily SST (interpolated from weekly SST) (8) Add diurnal cycle into daily SST
Control GPCP New I.C. Explicit scheme Monthly SST+ Diurnal 98 SST Daily SST+ Diurnal Daily SST
SST & Cu. Parameterization • Changing precipitation parameterization schemes do not significantly affects the results. • New initialization improves the results. But, model “lost the memory” of the new initial condition after about 1 month. • SST has a profound influence on precipitation prediction: • 98 SST produces better results than 97 SST • Adding diurnal cycle in itself does not produce improved results • Using daily SST with diurnal cycle helps the simulation. • Issues with “prescribed SST”: • No “interaction” between atmosphere-ocean • No “cut-off” of solar radiation as a result of convection, and no “cooling-off” of SST • The warm (just by a few degree) 1997 SST keeps triggering convections
Next Phase of NRCM Experiments • Nest a 60-km NRCM (one-way) within CCSM-3 T-85 climate simulations, with 21st century A2 scenario. • Conduct 60-km runs: • 5 ensemble members • Four 5-year period: • 1998-2002, 2018-2022, 2038-2042, 2058-2062 • Conduct 20-km nested runs for North America, and North Atlantic (for hurricane simulations) • Conduct 4-km nested runs over western U.S. • One-way nesting will be the primary approach. Selected tests with 2-way nesting will be performed.
Next Phase of NRCM Experiments 4-km 20-km 20-km 60-km
1996 1997 1998 1999 2000 2001 2002 2003 2004 2005 OBS NRCM OBS NRCM OBS NRCM
1997 1996 1998 1999 2000 2001 2003 2002 2005 2004