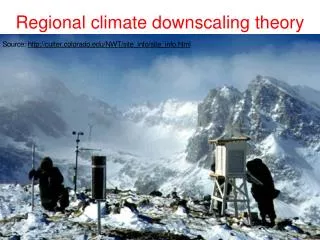
The Regional Climate
This presentation, led by Roger A. Pielke Sr., Professor and State Climatologist at Colorado State University, explores the influences of regional climate on water resources in Colorado. The discussion focuses on the importance of historical climate data in assessing future vulnerabilities and the complexities involved in climate predictions. As Colorado deals with fluctuating snowpack levels and drought conditions, understanding these dynamics is crucial for effective environmental management and conservation efforts. Join us as we delve into the challenges and strategies for predicting precipitation in the region.

The Regional Climate
E N D
Presentation Transcript
The Regional Climate Roger A. Pielke Sr. Professor & State Climatologist Colorado State University and Duke University CSU Speaker Series on Water in the Sustainable Landscape: Conservation and Beyond Fort Collins, Colorado February 2, 2004
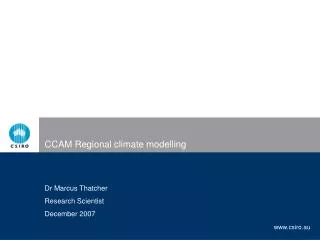
April 1 Snowpack http://www.co.nrcs.usda.gov/snow/data/historic.html
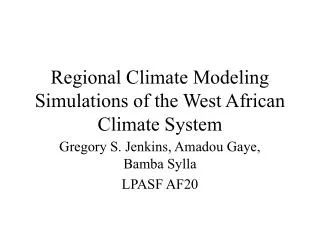
Colorado snowpack by basin http://www.co.nrcs.usda.gov/snow/data/getsummaries.html
Colorado Statewide Snowpack http://www.co.nrcs.usda.gov/snow/data/basins.html
Colorado Statewide Reservoir Levels http://www.co.nrcs.usda.gov/snow/watersupply/
Projected Conditions at 0.2 Probability Level 12 Month SPI at 6 months
Projected Conditions at 0.5 Probability Level 12 Month SPI at 6 months
Projected Conditions at 0.8 Probability Level 12 Month SPI at 6 months
TemperatureDec 2003 – Feb 2004 From the Colorado Prediction Center http://www.cpc.ncep.noaa.gov/products/predictions/multi_season/13_seasonal_outlooks/color/churchill.html
PrecipitationDec 2003 – Feb 2004 From the Colorado Prediction Center http://www.cpc.ncep.noaa.gov/products/predictions/multi_season/13_seasonal_outlooks/color/churchill.html
Figure provided by T.N. Chase, University of Colorado, Boulder.
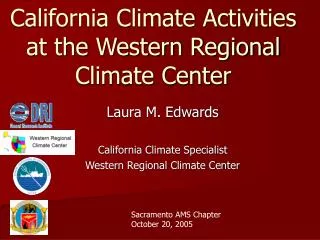
Maximum-minimum temperature sensor (MMTS) installation near Lindon, Colorado.
Maximum-minimum temperature sensor (MMTS) installation near John Martin Reservoir, Colorado.
Map of study region, showing all surveyed COOP sites. The USHCN sites are indicated by stars. The following photos are for HCN sites.
Photographs of the temperature sensor exposure characteristics of the NWS COOP station at Eads, CO. Panel a) shows the temperature sensor, while panels b)-e) illustrate the exposures viewed from the temperature sensor looking N, E, S, and W, respectively.
Photographs of the temperature sensor exposure characteristics of the NWS COOP station at Holly, CO. Panel a) shows the temperature sensor, while panels b)-e) illustrate the exposures viewed from the temperature sensor looking N, E, S, and W, respectively.
Photographs of the temperature sensor exposure characteristics for the NWS COOP station near Rocky Ford, Colorado. Panel a) shows the temperature sensor, while panels b)-e) illustrate the exposures viewed from the temperature sensor looking N, E, S, and W, respectively. (CRS-Cotton Region Shelter)
Photographs of the temperature sensor exposure characteristics of the NWS COOP station at Trinidad, Colorado. Panel a) shows the temperature sensor, while panels b)-e) illustrate the exposures viewed from the temperature sensor looking N, E, S, and W, respectively.
Photographs of the temperature sensor exposure characteristics of the NWS COOP station at Cheyenne Wells, Colorado. Panel a) shows the temperature sensor, while panels b)-e) illustrate the exposures viewed from the temperature sensor looking N, E, S, and W, respectively.
Photographs of the temperature sensor exposure characteristics of the NWS COOP station at Lamar, Colorado. Panel a) shows the temperature sensor, while panels b)-e) illustrate the exposures viewed from the temperature sensor looking N, E, S, and W, respectively.
Photographs of the temperature sensor exposure characteristics of the NWS COOP station at Wray, Colorado. Panel a) shows the temperature sensor, while panels b)-e) illustrate the exposures viewed from the temperature sensor looking N, E, S, and W, respectively.
Photographs of the temperature sensor exposure characteristics of the NWS COOP station at Las Animas, Colorado. Panel a) shows the temperature sensor, while panels b)-e) illustrate the exposures viewed from the temperature sensor looking N, E, S, and W, respectively.
Fort Morgan site showing images of the cardinal directions from the sensor (from Hanamean et al. 2003)
Policy Statement on Climate Variability and Change by the American Association of State Climatologists (AASC) 1.Past climate is a useful guide to the future - Assessing past climate conditions provides a very effective analysis tool to assess societal and environmental vulnerability to future climate, regardless of the extent the future climate is altered by human activity. Our current and future vulnerability, however, will be different than in the past, even if climate were not to change, because society and the environment change as well. Decision makers need assessments of how climate vulnerability has changed. 2. Climate prediction is complex with many uncertainties. The AASC recognizes climate prediction is an extremely difficult undertaking. For time scales of a decade or more, understanding the empirical accuracy of such predictions - called “verification” - is simply impossible, since we have to wait a decade or longer to assess the accuracy of the forecasts. Available at: http://ccc.atmos.colostate.edu/policystatement.php
Colorado Climate Center Pielke Research Grouphttp://blue.atmos.colostate.edu • Data and Power Point Presentations available for downloading • http://ccc.atmos.colostate.edu • click on “Drought” • then click on “Presentations”