Raster Data Model
Raster Data Model. How to Represent Point Features in Raster Data Models. How to Represent Line Features in Raster Data Models. How to Represent Polygon Features in Raster Data Model. Raster Data Models. For Raster Model there are Array of pixels (each pixel representing a specific value)

Raster Data Model
E N D
Presentation Transcript
Raster Data Models • For Raster Model there are • Array of pixels (each pixel representing a specific value) • A matrix consisting of rows and columns with each grid or pixel representing a specific value
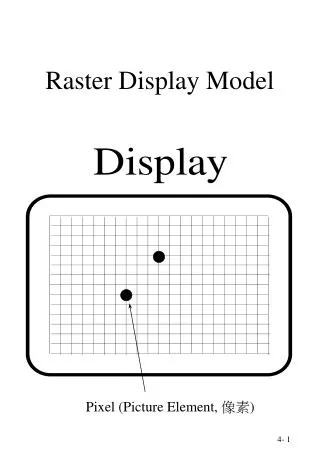
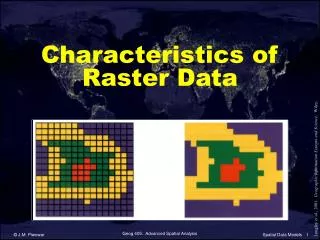
Raster Data Model • Raster data is an abstraction of the real world where spatial data is expressed as a matrix of cells or pixels with spatial position implicit in the ordering of the pixels • They store each cell in the matrix regardless of whether it is a feature or simply 'empty' space • Typically these cells are square and evenly spaced in the x and y directions
Cell Value • Cell values can be either positive or negative, integer, or floating point • Integer values are best used to represent categorical (discrete) data • Floating-point values to represent continuous surfaces • Cells can also have a ‘No Data’ value to represent the absence of data
Grid Size and Resolution • Pixel/cell refers to the smallest unit of information available in an image or raster map • Cell dimension specifies the length and width of the cell in surface units, e.g. the cell dimension may be specified as 30 meters on each side • volume of data increases as the cell dimension gets smaller • Reducing the cell dimension by four causes a sixteen fold increase in the number of cells • Smaller cell size provides greater spatial detail
Raster Data Model 16 m 16 m • Larger Cell Size • Lower resolution • Lower feature spatial accuracy • Faster display • Faster processing • Smaller file size • Smaller Cell Size • Higher resolution • Higher feature spatial accuracy • Slower display • Slower processing • Larger file size
Data Accuracy with Cell • Value is correct when variable value is uniform over the raster cell • In case of within cell variation then average, central or most common value prevails Mixed Pixel Problem
Types of Raster Data • Thematic Raster • Like a map describes the features and characteristics of an area and their relative position in space • Cell values are measured quantity or classification of a particular phenomenon (either integers or real numbers • Stored in a single band • Image Raster • Cell values represent reflected or emitted light/energy • Usually in 3 bands • Satellite image or scanned photographs
Rasters – As Thematic Map • By grouping the values of multispectral data into classes (such as vegetation type) and assigns a categorical value
Raster – As Surface Map • Rasters provide an effective method of storing the continuity as a surface
Rasters – As Attributes of a Feature • Rasters used as attributes of a feature may be digital photographs, scanned documents, or scanned drawings related to a geographic object or location
Raster Attribute Table • Raster values and other attributes are stored in the Value Attribute Table (VAT) • A thematic raster contains at least two items in its VAT • Value: • Represents some characteristics being mapped • Count: • Number of cells that share the same value
Zone and Region • Cells with same value makeup ‘Zone’ • The size of the zone is defined by the ‘count’ item • A set of contiguous cells with the same value is called a ‘Region’
‘NoData’ Value • Represents missing or unknown information • When a cell is vacant, it’s assigned ‘NoData’ value • ‘NoData’ remain always ‘NoData’ for ESRI rasters unless specifically requested • Combining 2 or more ESRI rasters will retain ‘NoData’ values in the outer raster
Acquiring Raster Data • Satellite Remote Sensing • Aerial Imaging • USGS Raster sources • DOQQ: Digital Orthophoto Quarter Quads are rectified scanned aerial photographs • DRG: Digital Raster Graphics are scanned USGS topo sheets • DEM: Digital elevation model (DEM) is a digital representation of ground surface topography
Data Sources • Digitizing existing maps • Scanning existing maps • Digital photogrammetric map production • Entry of computed coordinates from field measurements
DOQQ DRG DEM
Raster Data – A Simple Data Structure • A simple data structure—A matrix of cells with values representing a coordinate and sometimes linked to an attribute table
Advantages of Raster Data Formats • Can represents different types of continuous surfaces and ability to perform surface analysis • Computing/processing is fast • Surface data faster to display • Overlaying maps is easy • Integration of remotely sensed imagery is straightforward • Tiling facilitates easy handling of large data • Good for accomplishing complex analysis operations through complex raster expressions (A huge variety of complex spatial and advanced statistical analyses are supported) • Only solution for some application which can not handled by vector • Hydrologic modeling, spread of wild fire, air pollution dispersion etc.
Disadvantages of Raster Data Formats • Spatial inaccuracies due to the limits imposed by the raster dataset cell dimensions. • Very large datasets needs more memory space and more processing time • Changing cells to one-half the current size requires as much as four times the storage space • There is also a loss of precision
Advantages/Disadvantages of Raster and Vector Source: http://www.geom.unimelb.edu.au/gisweb/GISModule/GIST_Raster.htm
Homework 1 (T) Read Chapter 2 of the Text Book (Bolstad) – (specially the sections covered in class lectures)
Spatial Data Conversion • Vector to Raster or Rasterization • Raster to Vector or Vectorization Converted data is less accurate than original data
Vector to Raster (V2R) • Assign a cell value for each position occupied by vector features
Vector to Raster Encoding Methods • Center Cell Method • The center location of the cell determines the raster value encoded from the vector data • Majority of Cell Method • The value in the vector dataset that covers the majority of the cells determines the cell value • Weighted Cell Method • Analyst determines which vector value is most important by weighting the options • Percent of cell method • Encodes the cell by multiple values based on the percentage of the cell taken up by each feature
Conversion of Vector Point Feature • Represented by a value in a raster cell • Assigned to the cell containing the point coordinate • Have at least the dimension of the raster cell after conversion Problem: • If the cell size is too large, two or more vector points may fall in the same cell • To avoid this problem a cell size is chosen having the diagonal dimension smaller than the distance between the two closest point features
Conversion of Vector Line Feature • Output depends on the input algorithm used • Raster cells may be coded using different criteria/rules • Assign a value to a cell if a vector line intersects with any part of the cell • Line connections maintained • Wider lines
Conversion of Vector Line Feature • Assign a cell as occupied by a line only when the cell center is “near” a vector line segment • May lead to discontinuity in lines • Thinner linear features
Conversion of Vector Area Feature • Boundaries among different polygons are identified as in vector to- raster conversion for lines • Assign the cell to the area if more than one half the cell is within the vector polygon OR • Assign a raster cell to an area feature if any part of the raster cell is within the area contained within the vector polygon • Interior regions are then identified • Each cell in the interior region is assigned a given value