Screens and operation
220 likes | 241 Vues
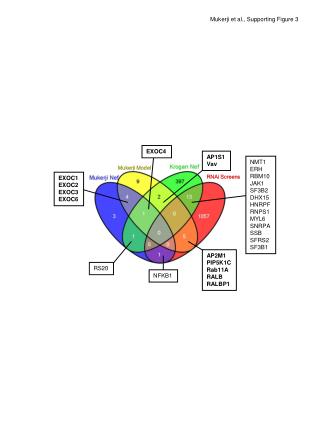
The Weir DMA Automated Analysis System provides efficient wafer tracking, networked factory controllers, and automated process control for semiconductor manufacturing. Enhance efficiency with Weir DM systems.

Screens and operation
E N D
Presentation Transcript
Weir DM / DMA Screens and operation TEA Systems Corp. 65 Schlossburg St. Alburtis, PA 18011 610 682 4146 TZavecz@TEAsystems.com www.TEAsystems.com July 15, 2005
Focus -0.24 -0.16 -0.08 0.0 +0.08 +0.16 +0.24 Dose= 18 19 20 21 22 23 24 Process Window The Weir DMA Automated Analysis Semi’ Equipment Focus Wafer Tracks Networked Factory Controllers & APC Metrology DoF Weir DM User Interface Servers APC Systems Automation Systems
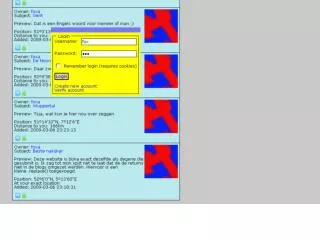
Weir DMA run interface • Interface appears when called • Program supplied call and optional data file, model, type of analysis and Weir DMA Macro to use • Analysis run independent of the user • Program will time out if data is not available of if it is held-up by the user. • Program restarts on next DMA call Weir DM/DMA
Weir DMA Macro Setup Interface Screens
Source • Specifying the source location of the data for the Macro Weir DM/DMA
Process Window Setup 2 • Variables to analyze and their target PW ranges Weir DM/DMA
PSFM Focus Matrix Weir DM/DMA
PSFM Fixed Focus Weir DM/DMA
Current Analysis Display • After a display is completed Weir DMA will • Display the results of the current dataset • Copy data for this dataset into the trend charts • This screen selects the current display graphic and statistics for reporting Weir DM/DMA
Focus Analysis options setup Weir DM/DMA
Dose Analysis Options Weir DM/DMA
PW Trend Charts • These selected the Modeled Variables to be: • displayed on the current display (Push-buttons) • Saved in the Trend Plots (check boxes) Weir DM/DMA
Raw Data Statistics Setup Weir DM/DMA
Weir PW process window controls Weir DM/DMA
PW analysis options Weir DM/DMA
Process Window • Tools to view the current graphics after an analysis Weir DM/DMA
Dose @ best focus • Feature size vs Dose AFTER focus errors are removed • AND Best Focus response as a function of dose Weir DM/DMA
Dose @ Best Focus Weir DM/DMA
CDvsDose Report • Portion of the CD vs Dose report saved in the data spreadsheet Weir DM/DMA
CD vs Focus Graph Weir DM/DMA
CD vs Focus Report Weir DM/DMA