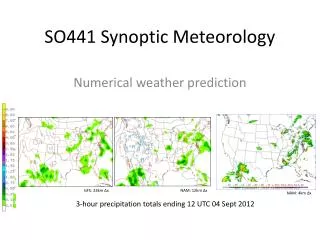
Download
1 / 96
980 likes | 1.03k Vues
Explore the historical development of synoptic meteorology from ancient ideas to modern networks and instruments, including key figures like Aristotle and Ben Franklin. Learn about the early synoptic networks and the first synoptic charts. Uncover the debate on midlatitude weather systems and the theories proposed. Discover how early meteorologists like Dove and Espy contributed to understanding cyclone formation.

E N D
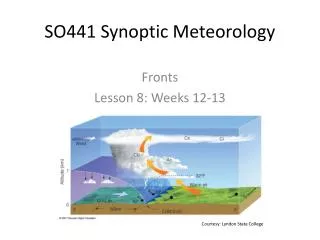
Ancient Synoptic Ideas • The Book of Job (37:22) states, “Fair weather cometh out of the north”, which is true for many midlatitude locations when cold, high-pressure systems are found north of the observer • In his comprehensive volume, Meteorologica, Aristotle suggested that a close examination of the sky could provide useful forecasts. • One of Aristotle’s pupils, Theophrastus of Ereos, noted in his volume On Weather Signs that “If the breezes come from the east or south, rain is indicated; if from the west or north, breezes and cold weather.”
And, Of Course, Many Ancient Societies Summarized Synoptic Wisdom in Sayings • "Red Sky at night, sailor's delight. Red sky in the morning, sailor take warning.” • "Clear moon, frost soon.” • "Halo around the sun or moon, rain or snow soon." • "Rainbow in the morning gives you fair warning.”
But there was a major problem: prior to roughly 1750 meteorological instruments lacked the accuracy, repeatability and common scales that are mandatory for a viable meteorological network. A thermoscope constructed by Galileo Galilei around 1600 A.D. Picture courtesy of Museo Galileo
By the late 1700s, reasonable (sufficiently precise and repeatable) weather instruments became available and some “universal” scales were developed In 1665 Christian Huygens suggested using the freezing and boiling points of water as standards, and in 1724 Daniel Fahrenheit proposed a scale with 32F for freezing and 212F for boiling and used this scale in the first mercury thermometers. In 1742 Anders Celsius introduced the temperature scale that bears his name (using 0 and 100°C for the freezing and boiling points, respectively).
More and more people took observations….and some early networks were started (observers mailed their observations to a central site or to each other)
Early Synoptic Networks • 1792 the Mannheim (or Palatine) network included 39 stations from France, Germany, Italy, Scandinavia, Poland and Russia. • In the United States a formal observation program was initiated in l816 under the auspices of the surgeon-general of the army; army surgeons were required to take three observations per day of pressure, temperature, state of sky and winds. Bu 1853, nearly 100 army posts were providing daily reports. • Other American networks were organized under the auspices of the U.S. Navy and the Smithsonian Institution.
Ben Franklin, the Synoptician • In a letter dealing with the origin of northeast U.S. storms, dated May 12, 1760, he concluded, based on the visibility of a 1743 lunar eclipse at various locations, that the storm was moving to the northeast even though the winds at the surface were from the northeast. • The implication of these observations, which Franklin clearly appreciated, is that might be possible to predict storm motion if information could move faster than the storms, something that was not practical during the late 18th century.
Observing Networks Led to the First Synoptic Maps Perhaps the first surface weather map was created by H. W. Brandes in 1820 for March 6, 1783. The arrows indicate wind direction and the lines show the deviation of pressure from average conditions
One of the weather maps created by Elias Loomis in his groundbreaking paper on the storms of February 1842. Surface wind direction is indicated by arrows and the deviations from average pressure are shown by the dashed lines. Temperatures are indicated by dotted lines and the sky or precipitation type by the color shading. This map indicates a strong low-pressure center over the Ohio Valley, rain on the coast, and snow-laden northwesterly winds to the west.
The New Synoptic Charts Stimulated a Great Debate on the Nature of Midlatitude Weather Systems During the First Half of the 19th Century
Why Do Cyclones Form? • During the first half of the nineteenth century several competing theories of the origin and development of midlatitude storms were proposed: • the linear two-current theory of Heinrich Dove • the centrifugal theory of William Redfield • the thermal or convective hypothesis of James Espy.
Heinrich Dove: two opposing currents • Dove, one of Europe's great authorities on meteorology and later Director of the Prussian Meteorological Institute, proposed that midlatitude storms result from the interaction of two linear, opposing wind currents: • a cold, dry, current originating in the polar latitudes • a warm, humid flow from the equatorial zone. • According to his theory, weather changes occur as one current displaces the other. Furthermore, Dove insisted that the resulting disturbances are not necessarily vortical or rotating in nature. L
James Espy: The Thermal Theory of Cyclones • James Espy (1830's) proposed a convective or thermal hypothesis of storm origin. • Espy noted that storms are usually associated with clouds and precipitation and thus must be areas of rising motion. He suggested that storms are analogous to huge heat engines, being driven by latent heating in the ascending air columns. • Such heating forces the isobaric surfaces above the storm to rise, resulting in mass outflow at upper levels and the diminution of pressure at the surface. • Espy did not indicate any circulation around midlatitude cyclones, but noted only a radial component towards their centers. Anticyclones were assumed to be the hydrostatic reflection of cold air above the surface.
Thermal Theory • Thermal Theory conceptual model was dominant in the 1830s and for several subsequent decades. • Warm core with hurricane-like circulation • Accepted as main mechanism for much of the 19th century Low Espy 1831
William Redfield: Centrifugal Mechanism • William Redfield (1831) produced synoptic charts that showed that storm winds possess rotational and translational components. • He suggested that the rotational motion were created when the Northeast Trades pressed against "obstructions" such as the islands of the Caribbean Sea. Once in rotation, air would be pulled away from the storm's center by centrifugal forces, thus producing a lowering of pressure in the core of the storm. • Although stressing the vortical motion around disturbances, Redfield did note the existence of weak convergence towards their centers.
Elias Loomis • As more surface observations became available during the first half of the nineteenth century some of the contradictory elements of the above theories were resolved. • Completing a detailed series of case studies, Elias Loomis (1841), using the best synoptic charts created to date, showed conclusively that storms, at least in the United States, possess both inward and vortical motion. • Loomis accepted the basic tenets of the convectional theory, but went considerably further by suggesting that the initial upward motion that established the latent heating originated in the uplifting of warm air by cold air currents.
Loomis’s discussion of the meeting of such currents is one of the earliest descriptions of what later was to become known as a cold front. The figure below, taken from his work, presents what was probably the first cross section of a cold front. • Loomis also suggested that the rotation of air around low centers was caused by the deflection of the radial currents by the rotation of the earth.
Competing Ideas of Cyclone Airflows During the Mid-1800s Dove Redfield Espy Loomis
Weather Forecasting • Without a means for rapid dissemination of meteorological observations, early synoptic charts could only be created weeks or months after the actual collection of data. • Therefore, weather forecasting at this time was limited to the "local method," in which surface and cloud observations at a location were compared to "models" of weather evolution in order to predict future changes. • The advent of telegraphy around 1840-45 made possible the rapid distribution of weather data, so that synoptic charts could be prepared quickly enough to be operationally useful for diagnosing and forecasting the weather.
The Telegraphic Communication Revolution • By 1849 a telegraphic network was organized in the United States for the transmission of daily meteorological observations for a collection of stations. • In England during the l851 World's Fair, a telegraphic company prepared daily weather maps for display, and by 1859 the British Meteorological Department began to operationally distribute weather information using this new technology. The internet of the 19th century
The Revolution • With a rapid increase in the number of observing sites, the demonstrated usefulness of synoptic charts, and the availability of telegraphy, governments around the globe began to establish operational meteorological services. • In l854 Admiral Fitzroy, famed captain of Darwin's ship the Beagle, was appointed head of the new British Meteorological Service, which in l861 began issuing daily forecasts and storm warnings. • In 1870 the United States included the remnants of the Smithsonian observation network within a new national weather service located within the Signal Service of the U.S. Army. Daily forecasts and warnings began the next year. • Most of the larger European countries also set up government meteorological services during this period.
“Ol Probs” • Cleveland Abbe (“Ol’ Probabilities”), who led the establishment of a weather forecasting division within the U.S. Army Signal Corps. • Produced the first known communication of weather a weather forecast (including the term “probability”). Professor Cleveland Abbe, who issued the first public “Weather Synopsis and Probabilities” on February 19, 1871
On May 7, 1869, Abbe proposed to the Cincinnati Chamber of Commerce "to inaugurate such a system, by publishing in the daily papers, a weather bulletin, which shall give the probable state of the weather and river for Cincinnati and vicinity one or two days in advance”. Cleveland Abbe released the first public weather forecast on September 1, 1869. Following the signing by President Ulysses S. Grant of an authorization to establish a system of weather observations and warnings of approaching storms, on February 19, 1871, Abbe issued the first “official” public Weather Synopsis and Probabilities based on observations taken at 7:35 a.m.
An early example of a report: "Synopsis for past twenty-four hours; the barometric pressure had diminished in the southern and Gulf states this morning; it has remained nearly stationary on the Lakes. A decided diminution has appeared unannounced in Missouri accompanied with a rapid rise in the thermometer which is felt as far east as Cincinnati; the barometer in Missouri is about four-tenths of an inch lower than on Erie and on the Gulf. Fresh north and west winds are prevailing in the north; southerly winds in the south. Probabilities [emphasis added]; it is probable that the low pressure in Missouri will make itself felt decidedly tomorrow with northerly winds and clouds on the Lakes, and brisk southerly winds on the Gulf."
Push Back • The new technology of telegraph-based weather prediction was not welcomed by many in the tradition-bound scientific establishment of the day, who saw the new applied science as inconsistent with the proper theoretical approach to scientific inquiry. Furthermore, some fishing fleet owners objected to his storm warnings, which kept their ships in port. • A special committee of the British Royal Society recommended to the Board of Trade that storm warnings and daily forecasts be discontinued, and in December 1866 they were terminated. • The physicist François Arago, the director of the Paris Observatory before Le Verrier, made his establishment position quite plain: • “Whatever may be the progress of sciences, never will observers that are trustworthy, and careful of their reputation, venture to foretell the state of the weather.”
Fortunately, the value of the new telegraph-enabled weather maps and the infant science of synoptic meteorology were so obvious to so many, that national weather services and their new products were destined to spread rapidly during the second half of the 19th century.
Weather Prediction Technology of the Later 1800s • The essential approach…simple temporal extrapolation. • No fronts, but they understood that discontinuities existed. • Little understanding of the evolution of weather systems. • After a period of rapid increase in forecast skill, predictive skill leveled off.
The Theoretical Basis for Modern Synoptic Meteorology is Established During the Second Half of the 1800s
Between l850 and 1870 there were several major conceptual and theoretical advances in atmospheric kinematics and dynamics. • Although the basic equations of motion of a solid body on a rotating sphere were known since the beginning of the nineteenth century, William Ferrel (1855) was the first to formulate the dynamical equations of fluid motion for a rotating planet. • Ferrel also suggested that large-scale atmospheric motions are basically hydrostatic and geostrophic. • A geostrophic relationship between pressure and winds was also implied by C. H. D. Buys Ballot (1857) in the rule: " Winds always blow, in the northern hemisphere, with high barometer to the right and low barometer to the left of the direction in which they blow." Buys-Ballot also noted the proportionality between wind speed and pressure gradients
Atmospheric Thermodynamics • The period l850-1870 also brought major advances in atmospheric thermodynamics including: • the demonstration of the mechanical equivalent of heat • the derivation of the first law of thermodynamics • the accurate description of dry and moist adiabatic processes. • Furthermore, researchers such as Theodore Reye and H. Peslin established criteria for the vertical stability of air parcels. • Thus, by the end of this period the basic dynamic and thermodynamic principles governing atmospheric flows were known.
Structural Details of Cyclones • As more synoptic data became available during the second half of the nineteenth century, several individuals attempted to describe the horizontal and vertical structure of synoptic systems. • For example, Fitzroy (l863) presented a storm model that explicitly showed polar and tropical currents spiraling into cyclonic disturbances . He retained the mechanistic approach of Dove in which storms formed in the horizontal shear between two, contrasting air streams.
By 1860s the idea of two main airflows (warm and cold) and rotation was accepted cold Fitz-Roy 1863 warm
However, in contrast with Espy, Buchan and Mohn (1870s) and others stressed the asymmetric geometry of cyclone structure, with upward motion in the forward sector of the storm and descending motion to its rear. Warm air in front, cold air behind. • An asymmetric structure was also noted by Abercromby (l883) who created a schematic model of the distribution of clouds, precipitation, winds and pressure relative to the center of cyclonic storms.
But what about vertical structure? • With only sporadic soundings taken by balloons and kites, and only a scattering of mountain top observing sites, nineteenth century meteorologists lacked the direct measurements required to clearly define the upper-level structure of synoptic systems. • Using ten years of cloud observations, Ley found diffluence and divergence above and in front of surface cyclones, as well as a general westward tilt with height from the surface up to cirrus level. • A decade later Wladimir Koppen explained the backwards tilt as the hydrostatic result of the asymmetric temperature distribution of cyclones, with the trough axis tilting towards the cold air.
Thermal Theory on Defense • New observations and theoretical work were undercutting its basic foundation. • With ever growing experience in synoptic analysis, it became clear to many investigators (such as Loomis, l877) that barometric minima can form with little or no precipitation. • At the same time, observations at mountain stations (e.g., Hann, l877) strongly suggested that, at least in Europe, anticyclones were relatively warm above a shallow surface layer. • Mountain reports also indicated that cyclones were generally associated with cold air, in contradiction to the thermal theory which demanded a column of warm air to explain the low pressure at the surface.
Thermal Theory on Defense • It was becoming clear that the temperature structure of cyclones was highly asymmetric and that horizontal advection of warm air, not latent heating, was the major source of warming. • Several researchers proposed that horizontal temperature gradients played a crucial role in the development and evolution of cyclones. For example, Mohn (1870) suggested that cyclone intensity might be proportional to the temperature differences across a storm, and Reye (1873) attributed the stronger storms of winter to the larger temperature contrasts of that season. • Koppen and Miller (1882) suggested that the movement of synoptic disturbances are controlled by upper-level steering currents, and that dynamical forcing of divergence aloft was crucial for maintaining the upward motion of storm systems.
But what was the energy source of cyclones? • In 1897 Vilhelm Bjerknes developed the circulation theorem, which showed how baroclinicity could produce acceleration of air parcels. • Making use of a series of vertical soundings at the Blue Hill Observatory near Boston, J.W. Sanstrom, a student of Bjerknes, found that the pressure and density structure of a cyclone produced sufficient acceleration to explain the observed winds. • Detailed descriptions of the energetics of synoptic disturbances were produced by Bigelow (1903) and Margules (1903); the latter demonstrated that the kinetic energy of storms originated in the available potential energy resident in horizontal temperature gradients.
Did Meteorologists Know About Fronts Before the Norwegian Cyclone Model? • The existence and importance of lines of discontinuity in pressure and temperature became increasingly evident in the latter 19th and early 20th centuries.. • For example, Shaw and Lempert (1906) performed mesoscale analyses of the structure and movement of frontal zones in Northern Europe; to them the abrupt changes in pressure suggested "fault lines" in their isobaric analyses. • Lempfert and Corless (1910) created vertical cross sections through the "line squalls" or fronts, as we now call them.
In work that clearly foreshadowed the polar front model of the Bergen School, Shaw (1911) presented a schematic cyclone model that clearly showed wind and temperature discontinuities associated with cold and warm fronts (but without the names!)
But how can cold and warm air sit side by side in a stable equilibrium? • Margules set up a mesoscale network of mountain and low-level stations to examine the structure of temperature discontinuities; an important question at that time was how contiguous air masses of different temperature and density could remain in a stable configuration. • Margules (1906) showed that the Coriolis force allows cold and warm air to exist side by side, and that the interface between the two air mass slopes at an angle determined by the magnitude of the Coriolis force, the temperature gradient, and the horizontal wind shear.
The Next Major Advance • The Norwegian Cyclone Model, around 1920