Download
1 / 2
30 likes | 304 Vues
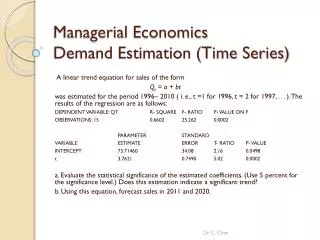
Managerial Economics Demand Estimation (log-linear). The empirical demand function for good X is estimated in log- linear form as ln Q = 11.74209 – 1.65 ln P + 0.8 ln M – 2.5 ln P Y

E N D
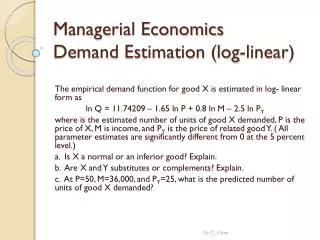
Managerial Economics Demand Estimation (log-linear) The empirical demand function for good X is estimated in log- linear form as ln Q = 11.74209 – 1.65 ln P + 0.8 ln M – 2.5 ln PY where is the estimated number of units of good X demanded, P is the price of X, M is income, and PY is the price of related good Y. ( All parameter estimates are significantly different from 0 at the 5 percent level.) a. Is X a normal or an inferior good? Explain. b. Are X and Y substitutes or complements? Explain. c. At P=50, M=36,000, and PY=25, what is the predicted number of units of good X demanded? Dr. C. Chen
Managerial Economics Demand Estimation (log-linear) The empirical demand function for good X is estimated in log- linear form as ln Q = 11.74209 – 1.65 ln P + 0.8 ln M – 2.5 ln PY where is the estimated number of units of good X demanded, P is the price of X, M is income, and PY is the price of related good Y. ( All parameter estimates are significantly different from 0 at the 5 percent level.) a. Is X a normal or an inferior good? Explain. In a log-linear demand function, the coefficients of indep. variables are the elasticities directly. Therefore, the income elasticity, EM= 0.8 > 0. It is a normal good. b. Are X and Y substitutes or complements? Explain. EXY= −2.5 < 0; they are complements. c. At P=50, M=36,000, and PY=25, what is the predicted number of units of good X demanded? ln Q = 11.74209 – 1.65 ln(50) + 0.8 ln(36,000) – 2.5 ln(25) = 6.81979 Q= e6.81979 =916 Dr. C. Chen