Download
1 / 9
90 likes | 218 Vues
The Wyoming Department of Environmental Quality Air Quality Division (DEQ-AQD) has updated the Regional Haze Plan using data from the TSS to enhance understanding of visibility impairment in Class I areas. This visualization for the Board and public includes a baseline analysis of the worst visibility conditions from 2000-2004, alongside projections for natural conditions by 2064. Key emissions data on controllable and uncontrollable NOx and SOx emissions highlights contributions to visibility impairment, aiding in proactive environmental strategies.

E N D
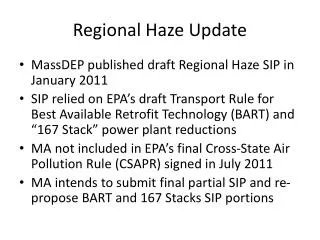
TAF Regional Haze Plan Update Wyoming DEQ-AQD
TSS/ WRAP Products Wyoming uses data products directly from TSS to insert into SIP and to “paint a picture” of visibility impairment in Class I for our Board and public.
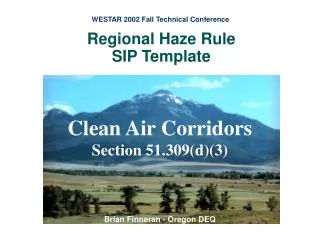
Scene Monitoring Archive Example of 2000-2004 Baseline (Worst) Conditions dv = 11; Bext = 30; VR = 130 Example of 2064 Natural Conditions (Worst) dv = 7; Bext = 20; VR = 200 Episode 8/22/88 – 9/10/88 Photograph Taken 8/24/88 Episode 8/22/88 – 9/10/88 Photograph Taken 8/27/88
Summary Table for Worst Visibility Days 1 Unitless value. 2 Monthly weighted. * Baseline data for this site (BRID1) begins in year 2000. Source: WRAP TSS>>Resources>>Monitoring>>Aerosol Trends Tool Source: WRAP TSS>>Resources>>Modeling>>Modeling Results Browser>>Visibility Modeling>>Model Projections