Discrete-Time Models
Discrete-Time Models. Lecture 1. When To Use Discrete-Time Models. Discrete models or difference equations are used to describe biological phenomena or events for which it is natural to regard time at fixed (discrete) intervals. The size of an insect population in year i ;

Discrete-Time Models
E N D
Presentation Transcript
Discrete-Time Models Lecture 1
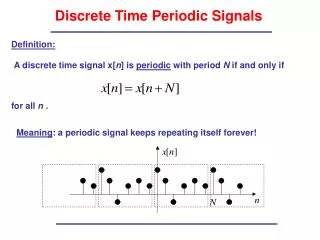
When To Use Discrete-Time Models Discrete models or difference equations are used to describe biological phenomena or events for which it is natural to regard time at fixed (discrete) intervals. • The size of an insect population in year i; • The proportion of individuals in a population carrying a particular gene in the i-th generation; • The number of cells in a bacterial culture on day i; • The concentration of a toxic gas in the lung after the i-th breath; • The concentration of drug in the blood after the i-th dose. Examples:
What does a model for such situations look like? • Let xn be the quantity of interest after n time steps. • The model will be a rule, or set of rules, describing how xn changes as time progresses. • In particular, the model describes how xn+1 depends on xn (and perhaps xn-1, xn-2, …). • In general: xn+1 = f(xn, xn-1, xn-2, …) • For now, we will restrict our attention to: xn+1 = f(xn)
Terminology The relation xn+1 = f(xn) is a difference equation; also called a recursion relation or a map. Given a difference equation and an initial condition, we can calculate the iterates x1, x2 …, as follows: x1 = f(x0) x2 = f(x1) x3 = f(x2) . . . The sequence {x0, x1, x2, …} is called an orbit.
Question • Given the difference equation xn+1 = f(xn) can we make predictions about the characteristics of its orbits?
Modeling Paradigm • Future Value = Present Value + Change xn+1 = xn + D xn • Goal of the modeling process is to find a reasonable approximation for D xn that reproduces a given set of data or an observed phenomena.
Example: Growth of a Yeast Culture The following data was collected from an experiment measuring the growth of a yeast culture: Time (hours) Yeast biomass Change in biomass npnDpn = pn+1 - Dpn 0 9.6 8.7 1 18.3 10.7 2 29.0 18.2 3 47.2 23.9 4 71.1 48.0 5 119.1 55.5 6 174.6 82.7 7 257.3
Change in Population is Proportional to the Population Change in biomass vs. biomass Dpn Dpn = pn+1 - pn ~ 0.5pn Change in biomass 100 50 pn 50 100 150 200 Biomass
Explosive Growth • From the graph, we can estimate that Dpn = pn+1 - pn ~ 0.5pnand we obtain the model pn+1 = pn + 0.5pn = 1.5pn The solution is: pn+1 = 1.5(1.5pn-1) = 1.5[1.5(1.5pn-2)] = … = (1.5)n+1 p0 pn = (1.5)np0. This model predicts a population that increases forever. Clearly we should re-examine our data so that we can come up with a better model.
Example: Growth of a Yeast Culture Revisited Time (hours) Yeast biomass Change in biomass n pnDpn = pn+1 - Dpn 0 9.6 8.7 1 18.3 10.7 2 29.0 18.2 3 47.2 23.9 4 71.1 48.0 5 119.1 55.5 6 174.6 82.7 7 257.3 93.4 8 350.7 90.3 9 441.0 72.3 10 513.3 46.4 11 559.7 35.1 12 594.8 34.6 13 629.4 11.5 14 640.8 10.3 15 651.1 4.8 16 655.9 3.7 17 659.6 2.2 18 661.8
Yeast Biomass Approaches a Limiting Population Level 700 100 Yeast biomass 5 10 15 20 Time in hours The limiting yeast biomass is approximately 665.
Refining Our Model • Our original model: Dpn = 0.5pnpn+1 = 1.5pn • Observation from data set: The change in biomass becomes smaller as the resources become more constrained, in particular, as pn approaches 665. • Our new model: Dpn = k(665- pn) pn pn+1 = pn + k(665- pn) pn
Testing the Model • We have hypothesized Dpn = k(665-pn) pn ie, the change in biomass is proportional to the product (665-pn) pn with constant of proportionality k. • Let’s plot Dpn vs. (665-pn) pn to see if there is reasonable proportionality. • If there is, we can use this plot to estimate k.
Testing the Model Continued 100 Change in biomass 10 50,000 100,000 150,000 (665 - pn) pn Our hypothesis seems reasonable, and the constant of Proportionality is k ~ 0.00082.
Comparing the Model to the Data Our new model: pn+1 = pn + 0.00082(665-pn) pn Experiment 700 100 Model Yeast biomass 5 10 15 20 Time in hours
The Discrete Logistic Model xn+1 = xn + k(N -xn) xn • Interpretations • Growth of an insect population in an environment with limited resources • xn = number of individuals after n time steps (e.g. years) • N = max number that the environment can sustain • Spread of infectious disease, like the flu, in a closed population • xn = number of infectious individuals after n time steps (e.g. days) • N = population size