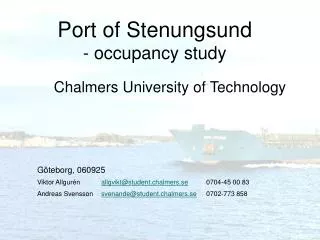
Enhancing Port Efficiency: Occupancy Study at Port of Stenungsund
This study conducted at Chalmers University of Technology analyzes occupancy levels and operational efficiency at the Port of Stenungsund, Sweden's 11th largest port. It highlights the significance of optimizing jetty usage through effective documentation, planning, and joint organization among the five companies operating in the port. Key findings indicate that an occupancy interval of 60-75% is optimal and that there is a need for a new pier to accommodate growing demands. Recommendations include enhanced joint documentation, web-based planning systems, and strategic expansions for improved throughput.

Enhancing Port Efficiency: Occupancy Study at Port of Stenungsund
E N D
Presentation Transcript
Port of Stenungsund- occupancy study Chalmers University of Technology Göteborg, 060925 Viktor Allgurén allgvikt@student.chalmers.se 0704-45 00 83 Andreas Svensson svenande@student.chalmers.se 0702-773 858
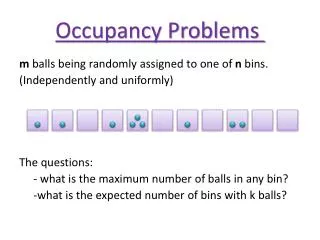
Introduction Major thesis conclusions • Five companies operating in the 11th largest port • 7 expansions 2007-2010 doubled turnover 2010 -Worst case 89% • 1/5 of all laytime is documentation time (not value adding) • Stay under occupancy interval 60-75 % • Need for effectiveness (a new pier)
Introduction Agenda • Introduction • Occupancy study • Joint organization for the port • Solutions • Summary/Conclusions
Introduction Methodology
Introduction Jetty locations- Port of Stenungsund At weight limitation – not possible for more equipment
Introduction Largest ports in Sweden 2005 Source: SIKA, 2006:16 Port of Stenungsund: • Roughly 6.2 million tons 2010 -Vattenfall’s pier 2,5 million tons • 600 ships in 2005 • 1,200 ships in 2010
Introduction Complexity in Stenungsund Source: Borealis, 2000
Introduction Companies using the pier EFAB • First come first serve • Lack of cooperation in port • Port is equally important 1
Occupancy study Expansions 2007-2010 EFAB • Perstorp Oxo expansion ~ 5 times higher utilization 2010 than 2005 • EFAB (ethylene) ~ 2 times higher utilization 2010 than 2005 2
Occupancy study Occupancy per company
Occupancy study Future jetty occupancy • Worst case: 89 % • Pumping like 2005: 81 % • Average 2001-2005: 81 % • Estimated: 78 % • Best case: 74 %
Occupancy study Validation • Ship size • Documentation time • Pumping rate - + • 13 700 h laytime 2010 • 2 900 h doc time 21% of laytime 3
Occupancy study Maximum occupancy interval 60%-75% • 65 % has been confirmed (five references) • Varies within different ports • Increases with increasing flexibility • More companies, harder to be efficient • If occupancy above the interval for long time risk for stop in production 4
Occupancy study Overcapacity Efficiency (lean) vs. Effectiveness (overcapacity) • Variations in shipping -arrivals (weather, pilots) -documentation -pumping • Planning is hard • Many parties interacting • Need overcapacity to handle variations and uncertainties (five companies) • Overcapacity = new pier
Joint organization Earn when fast, pay when slow ”A ship at berth shall be active!” - Mats Eggers, Harbour Manager, Preem Brofjorden • Pay for time at berth –contracts with Vattenfall • Pay per ton handled –contracts with Hamntjänst • Incentive to be faster - Save money (loading master, lab costs, Hamntjänst etc.) • Increase efficiency
Joint organization Rules for sequencing • Documents setting the rules for when to prioritize - Common sequencing cases in one document - One standard document to fill in • Recommended sequencing rules - Use shortest processing time (SPT) - Emergency sequencing (to avoid stop in production) -Companies must agree upon these rules
Joint organization Joint documentation • Find out “best practice” • Will save laytime • Will save personnel for the companies • The ship does not have to wait for personnel • When queue: - Ship occupying the pier - You are occupying the pier • Do documentation in the anchoring area
Joint organization Web-based planning system • Plan ships short- and longterm • Keep statistics • Give idea of laytime • Include: -AIS -Booked pilots -Ship info • Password protected • Available for: -The five companies - Pilots - Agents - Tugboats - Shipowners
Solutions Aims – our solutions/improvements Increase maximum occupancy interval Decrease laytime Decrease waiting time Some solutions are of dynamic character
Solutions Realisticsolutions(some of these solutions must be implemented) Medium • Move marginal flows to Havden/Hydro (raps/RME) (700 h) • Pre-work for buoy unloading • Better pump capacity -Booster pump (700 h) -Thicker pipelines -Improved pumps (500 h) Short • Web-based planning system • Joint documentation (1,000 h) • Statistics • Rules for sequencing • Pay per hour, not per ton (500 h) • Regular meetings • “Sveriges hamnar” organization • Environmental certificate for a new pier • Larger ships when possible Strategic • New pier (5,000 h) 5
Solutions Brainstorming(Everything is allowed) • Optimal sequencing • Increase flexibility • -use both sides (dredge, loading arms, pipelines) • -use Havden and Saltkajen for more products • Buoy unloading (ethane) • Three locations on the pier, like Skarvikshamnen • Move the pipelines to the middle of the pier, everybody • can use both sides, minimum use of hoses • Extend Vattenfall’s pier
Solutions New pier locations • One new pier adds 8,760 h new laytime. 2010 = 13,700h laytime occupancy ~50 % 2010 (all piers) • Long time for environmental application
Solutions Price for a new quay (Close to Hydro’s pier) • Price estimated by Flygfältsbyrån to: ~ 20 million SEK Incl. unforeseen costs 15% Other costs: • Loading arm ~5 million SEK • Pipelines, valves, pipe bridge • Safety equipment • Etc.
Summary/conclusion Summary/Conclusion 1 • Five companies operating in the port without cooperation • 11th largest port in Sweden • 7 expansions 2007-2010 doubled turnover 2010 in the Port of Stenungsund • Worst case scenario 89 % occupancy 2010 • Stay under interval 60-75 % • Need for effectiveness and efficiency • Joint organization - No easy quick solution, all have to make an effort, otherwise sub optimization • Create incentive for shorter laytime • 1/5 of all laytime is documentation time (not value adding) • Statistics and web-based planning system • If a new pier estimated occupancy ~50 % 2010 • No financial payback for previous investments and efforts, however, economical incitements do NOW exist • Environmental application for new pier A.S.A.P! 2 3 4 5