Download
1 / 22
220 likes | 341 Vues
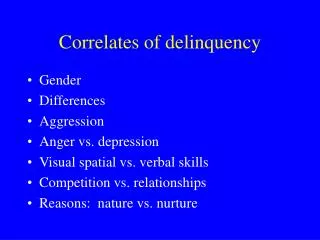
Correlates of Nursing Facility Occupancy. Presentation to HCBS Conference Arlington, VA September 18, 2014. Leslie Hendrickson Hendrickson Development. Purpose. Gain better understanding of factors affecting NF occupancy. Built two models and studied important zero-order correlations.

E N D
Correlates of Nursing Facility Occupancy Presentation to HCBS Conference Arlington, VA September 18, 2014 Leslie Hendrickson Hendrickson Development
Purpose Gain better understanding of factors affecting NF occupancy. Built two models and studied important zero-order correlations. • First model is % Medicaid Occupancy in NFs. The percentage of residents whose stay is paid for by Medicaid. • Second model is nursing facility population as percent of persons aged 75 and older. Why do some states have higher percentages of older persons in NFs?
Data Set • 29 variables from AARP Rising Expectations • 4 variables from OSCAR data • % Medicaid • % Medicare • % State NF occupancy • Total NF population by state • 9 variables from U.S. Census • 7 combinations of the above
Take Aways Six-variable model accounts for 82% of variance in the state NF Medicaid Occupancy % Four-variable model accounts for 67% of variance in state NF Population/number of Persons Age 75+ • AARP new Effective Transitions Dimension has internal coherence; • Aging and Disability Resource Centers have an Impact; • Cost of services and household Income have broad effect; • Pressure Sores make a Difference, as does • Access to Housing Alternatives instead of NF bed
These Two Models Study Different Measures of NF Occupancy • Began by thinking that the models would be two different ways to study the effect of level of care definitions. Wrong assumption. • Zero order correlation between Medicaid Occupancy % and NF population/persons aged 75 + is -.106.
Medicaid Occupancy % Model Analysis Six-variable model accounts for 82% of variance in the state NF Medicaid Occupancy % 1. Two collinear measures of nursing home cost. NF cost as % of household income age 65+ (.369) and NF private room cost (.422) Both positively correlated with Medicaid occupancy possibly because you spend down faster in higher cost states.
Medicaid Occupancy % Model Analysis 2. Home health aides per 1000 age 65+ positively correlated with Medicaid occupancy (.377). Tendency for more home health aides in larger states with higher income and more public assistance. Home health aides per 1000 positively correlated with: • % of adults with disability below 250% FPL receiving assistance (.430); • Medicaid LTSS use (.687); • Total number of persons age 65+ (.304) and 75+ (.301), and • Total population in state (.356).
Medicaid Occupancy Model % Analysis 3. States with higher rates of employment of persons with disabilities have lower Medicaid NF occupancy, (-.394) 4. % of home health admissions to hospital positively correlated (.418) with high rates of Medicaid NF occupancy. Assume persons go from hospital to NFs. Any process that sends persons to hospitals will be correlated with NF occupancy.
Medicaid Occupancy % Model Analysis 5. Percent below poverty age 18+ positively correlated (.375) with Medicaid NF occupancy %. 6. Percent rural and age 65+. Negatively correlated with Medicaid NF occupancy %, (-.543). Less use of public assistance among rural and old. NF also less expensive (-.387) in rural areas. Assisted Living and Residential units per 1000 Age 65+ almost made model. Negatively correlated with Medicaid NF occupancy % (-.410) indicating alternative housing with services has impact.
NF Population ModelAnalysis Four-variable model accounts for 67% of variance in state NF Population/Age 75+
NF Population Model Analysis 1. Median Household Income Age 65+. Zero order correlation is -.431 The less the income the higher the number of persons aged 75+ in NF. Having more income helps you buy alternative to NFs. 2. Percent of Nursing Home Residents with Low Care Needs (.500). The larger the population in NF the higher the percentage of low care needs.
NF Population Model Analysis 3. Percent of People with 90+ Day Nursing Home Stays Successfully Transitioning Back to the Community. Zero order correlation is -.712. Transition efforts associated with lower NF occupancy. 4. Percent of New Medicaid Aged/Disabled LTSS Users First Receiving Services in the Community Zero order correlation is -.427. The more persons receive their service in the community the fewer are in nursing homes. State LTSS programs make a difference not only to Medicaid populations but state as a whole.
Transitions back to the Community Strongly Correlated with Low Nursing Home Use :
Take Aways - Summary Six-variable model accounts for 82% of variance in the state NF Medicaid Occupancy % Four-variable model accounts for 67% of variance in state NF Population/number of Persons Age 75+ • AARP new Effective Transitions Dimension has internal coherence; • Aging and Disability Resource Centers have an Impact; • Cost of services and household Income have broad effect; • Pressure Sores make a Difference, as does • Access to Housing Alternatives instead of NF bed
References • AARP Rising Expectations 2014 http://www.aarp.org/home-family/caregiving/info-2014/raising-expectations-2014-AARP-ppi-health.html • Weiner et. al. Why nursing home utilization rates are declining, http://nasuad.org/sites/nasuad/files/hcbs/files/160/7990/SCGNursing.pdf • Hendrickson and Kyzr-Sheeley Determining Nursing Home Eligibility, http://nasuad.org/sites/nasuad/files/hcbs/files/137/6814/Nursing_Facility_Level_of_Care_FINAL.pdf
Contact Information • Leslie.c.hendrickson@gmail.com • For copy of Presentation go to http://hendrickson-consulting.com/publications/