Download
1 / 21
210 likes | 233 Vues
Explore the historical data and measurements of Solar EUV Monitor (SEM), examining solar flares observed by SEM and the Helium photoionization rate derived from CELIAS/SEM. Learn about SEM's components, data examples, and comparisons with other instruments. Discover the potential for future studies and calibrations with SEM data. Access SEM data on the web or by email for further analysis.

E N D
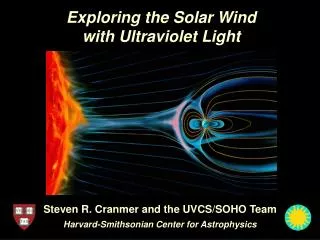
The Solar EUV Monitor on SOHO(CELIAS/SEM) Donald R. McMullin SECCHI Deputy Program Manager NRL / Praxis, Inc. June 21, 2006 Bern, Switzerland
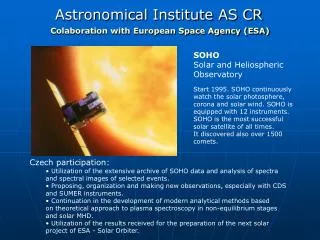
Acknowledgements Darrell L. Judge, Howard Ogawa, Andrew Jones, Matt Harmon SOHO/SEM Data USC Space Sciences Center SOHO/SEM data available at: www.usc.edu/go/spacescience
Overview • Introduction to the SOHO/SEM Instrument • Data examples • Calibration monitoring and comparisons • EUV and X-ray flares observed by SEM • Time cadence of SEM observations • Conclusions SEM = > LYRA Al channel
History of EUV Measurements • Many long gaps with little or no data • Never a continuous measurement over a solar cycle – Until CELIAS/SEM CELIAS/SEM Wavelength (nm) 0 50 100 OSO AEROS AE-E SM5 1960 1970 1980 1990 2000 Year
Solar EUV Monitor (SEM) • Components • 1 Transmission Grating • 1 Aluminum Filter • 3 Aluminum coated diodes • 3 science channels: • 1 central image (0.1-50nm) • 2 first order 30.4 nm (26-34nm)
Minimum EUV flux 3/10/96 27 day periodic features observed throughout the dataset
In-Flight Monitoring 3 Underflight Sounding Rocket Missions SEM Clone Rare Gas Ionization Cell 36.147US June 26, 1996 36.164US August 11, 1997 36.181US August 18, 1999
CELIAS/SEM FOC comparison to Mg II Index Note: Excellent agreement throughout the data set "The Mg II Index: A Proxy for Solar EUV," submitted to GRL, 2000, R. Viereck, D.R. McMullin, L. Puga, W.K. Tobiska, M. Webber, D.L. Judge. R. Viereck, NOAA SEC
Photoionization rates are calculated by folding the measured solar EUV irradiances into theoretical or laboratory measured photoionization cross sections. • The defining rate equation is applicable within an optically thin medium. • This method was employed by Banks and Kockarts [1973], Torr et al.[1979], and Torr and Torr [1985]
Helium Photoionization rate derived from CELIAS/SEM absolute EUV flux Jan 1, 1996 through Jan 31, 2001
Mission Launch Date STS-069 Sep. 1995 STS-085 August 1997 STS-095 October 1998 The Solar EUV Hitchhiker (SEH) • Helium Double Ionization Cell • Rare Gas Ionization Cell • NIST secondary transfer standard diodes • EUV spectrometer Direct measurements of the helium photoionization rate from the Space Shuttle
Historical comparison of Helium Photoionization rate values with the SEM-MgII Rate Proxy
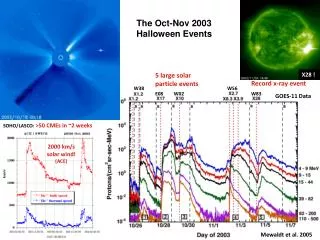
Here are some examples of solar flares observed by the SEM. Both EUV and x-ray channels are shown at 5 minute time cadence.
Looking at SEM high time cadence SEM is limited by quantization (compression), not solar noise.
Conclusions • SEM is a good candidate for LYRA Al channel comparisons. • LYRA can provide new information for SEM time cadence studies. • As is usual, calibrations may be a topic of future discussions. • SEM data is now available on web or by email. mcmullin@nrl.navy.mil