Download
1 / 46
480 likes | 711 Vues
Particle Swarm Optimization for Image Analysis Stefano Cagnoni Dipartimento di Ingegneria dell’Informazione Università di Parma. Particle Swarm Optimization. Optimization technique inspired by the collective behavior of flocks (swarms) of birds in search of food

E N D
Particle Swarm Optimization for Image Analysis Stefano Cagnoni Dipartimento di Ingegneria dell’Informazione Università di Parma
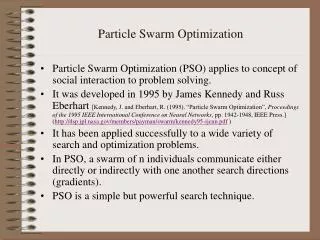
Particle Swarm Optimization Optimization technique inspired by the collective behavior of flocks (swarms) of birds in search of food • Each particle moves ‘randomly’ in the parameter space under the action of an attractive force field generated by: • the best point in the parameter space ever discovered by the particle itself • the best point in the parameter space ever discovered by the whole swarm
Particle Swarm Optimization • Basic PSO equations XP(t) = XP(t-1) + vP(t) vP(t) = w * vP(t-1) + c1 * rand() * [BestXP – XP(t-1)] + c2 * rand() * [gBestX – XP(t-1)] c1, c2 positive constants w inertia weight XP position of particle P BestXP best location reached by particle P up to time t-1 gBestX best location ever found by the whole swarm rand() random number between 0 and 1 The swarm converges towards the fittest point.
PSO and Image Analysis • Multi-objective optimization: the goal is to identify (segment out) one or MORE regions of interest (ROIs) in the search space (the image), not a single optimum. • k-mean clustering PSO (Passaro and Starita 2006): the swarm reorganizes itself in multiple sub-swarms: each sub-swarm may then ‘address’ a different target.
Applications • License Plate Detection: real time detection of the license-plate region within images of running cars • Pasta Segmentation:detection and segmentation of larger pasta pieces in images with variable lighting and background
Pasta Segmentation (GECCO 2006 competition) • Goal: to segment pieces of pasta, separating them from background and from ‘pasta noise’
Pasta Segmentation • k-mean clustering PSO (Passaro and Starita 2006): the swarm re-organizes itself in multiple sub-swarms: each sub-swarm may then ‘address’ a different target.
Pasta Segmentation First search stage: • Global search: we try to grossly detect, within the whole image, the most ‘promising’ areas
Pasta Segmentation Second search stage: • Local search: attention is focused on the ROIs detected in the previous stage to refine the borders of candidate pasta regions.
Pasta Segmentation Fitness function • Since pixels of a certain color are sought, fitness is based on distance in the RGB space if ( |r(x,y)-g(x,y)| < K1 and r(x,y)-b(x,y) > K2 ) punctual fitness = K1 - |r(x,y) – g(x,y)| else punctual fitness = 0 (K1=30, K2=60)
Pasta Segmentation Using only color information could cause swarms to converge towards ISOLATED pixels similar to the color prototype. • A local fitness term has been added, which depends on the number of neighbors of the current particle which have high punctual fitness fitness(x,y) = punctual fitness(x,y) + local fitness(x,y) where local fitness = K0 * number of neighbors
Pasta Segmentation • Basic PSO equation vP(t) = w * vP(t-1) + C1 * rand() * [BestXP – XP(t-1)] + C2 * rand() * [gBestX – XP(t-1)] The swarm converges towards the fittest pixels. However, the goal is to segment out whole pasta pieces and not only to detect points within them.
Pasta Segmentation • A repulsion term is added: vP*(t) = vP(t) + repulsionp • The repulsion term between two particles is computed, separately along each axis, as repulsion(i, j) = REPULSION_RANGE - |Xi-Xj| REPULSION_RANGE is the maximum distance within which the particles interact. • The global repulsion term for P is the average of all repulsion terms with particles interacting with it: repulsionp = j repulsion(p,j) / n
Pasta Segmentation • The standard equation has been further modified, to increase stability of sub-swarms. If a particle with high punctual fitness lies within a region with high density of particles, then it has a probability, which is linearly dependent on such a density, of staying there: • Prob{Xt-1=Xt} = number of particles in the neighbourhood / total number of particles in the swarm
Pasta Segmentation Global search • We assign each pixel a score which is proportional to the number of times a particle has flown over (or stayed on, if the particle stands still) it. • The higher the score of a pixel, the higher the probability for that pixel of representing pasta.
Pasta Segmentation • Each particle’s ‘influence area’ is actually a neighborhood of the current pixel, so the score of all the neighboring pixels is also increased by a term which decreases with distance: • To make statistics more stable, a number of runs are performed, each of which starts from a different random re-initialization of the whole swarm.
Pasta Segmentation • To bias the following step (local search) further, the dynamic range of the results of global search is stretched • Using the mean score as threshold, the pixel scores which are above the threshold are further increased, whilst the scores which are below the threshold are further reduced
Pasta Segmentation RESULTS AT THE END OF GLOBAL SEARCH
Pasta Segmentation Local search • Attention is focused onto the most interesting regions, limiting the domain where the swarm can move to sub-regions with high density of high-score pixels
Pasta Segmentation • The local search algorithm is conceptually very similar to the global search After global search After local search
Pasta Segmentation RESULTS AT THE END OF LOCAL SEARCH input image after local search
Pasta Segmentation Normalization and thresholding • Scores are normalized, after which a threshold is applied, to produce a binary output input image % of correctly classified pixels: 97.6% binary output
Pasta Segmentation input image after global search
Pasta Segmentation input image after local search % of correctly classified pixels after binarization: 95.8%
Pasta Segmentation input image after global search
Pasta Segmentation input image after local search % of correctly classified pixels after binarization: 92.6%
Pasta Segmentation input image after global search
Pasta Segmentation input image after local search % of correctly classified pixels after binarization: 90.3%
Pasta Segmentation input image after global search
Pasta Segmentation input image after local search % of correctly classified pixels after binarization: 92.8%
PSO-based License Plate Detection • Plates feature high density of pixels with high horizontal gradient values due to the contrast between letters (black) and plate background (white) • The horizontal gradient can be easily and efficiently approximated using differences
PSO-based License Plate Detection As for the pasta segmentation problem Two Search stages : • Global search: the most ‘promising’ areaswithin the whole imageare grossly detected • Local search: attention is focused on the ROIs defined in the previous stage to detect good plate candidates A repulsion term is introduced in the PSO equation
PSO-based License Plate Detection • The goal is to find regions featuring high density of high-gradient pixels • To prevent swarms from converging towards ISOLATED pixels, fitness has two terms: • punctual fitness, depending on visual features • local fitness, proportional to the number of neighbors
PSO-based License Plate Detection • The swarm explores a gray-scale image fitness(x,y) = punctual fitness(x,y) + local fitness(x,y) if ( |r(x,y)-g(x,y)|< K0 && |r(x,y)-b(x,y)|<K0 && |g(x,y)-b(x,y)| <K0 ) punctual_fitness = max(right_gradient,left_gradient); else punctual_fitness = 0; where right_gradient = |grayscale(x,y)-grayscale(x+1,y)|; left_gradient = |grayscale(x,y)-grayscale(x-1,y)|; local fitness = K1 * neighbor_number
PSO-based License Plate Detection • The standard equation has been further modified to increase stability of sub-swarms. If a particle with high punctual fitness lies within a region with high density of particles, then it has a probability, which is linearly dependent on such a density, of staying there: Prob { Xt-1=Xt } = number of particles in the neighborhood / total number of particles in the swarm
PSO-based License Plate Detection GLOBAL SEARCH RESULTS
PSO-based License Plate Detection Two ‘promising’ areas are detected (sub-swarms with Nparticles > T): the larger one will be explored first
PSO-based License Plate Detection The whole swarm is re-initialized near the selected area and a local search is performed, using the previous algorithm.
PSO-based License Plate Detection A bounding box is computed enclosing all particles with high punctual fitness. If this box has a w:h ratio = 5:1, we can assert we found the plate.
PSO-based License Plate Detection Otherwise the box is expanded, letting some agents move up and down (or left and right), in order to reach the given ratio. On failure, the next region is explored.
PSO-based License Plate Detection Final result
PSO-based License Plate Detection TEST RESULTS Set of 98 plates, 10 runs per plate = 980 runs N Avg. time Correct detections 955 0.083 s Wrong detections 15 0.151 s Plate not found 10 1.424 s In many cases performing the whole plate detection process has a lower computation cost than computing the gradient image
PSO-based License Plate Detection (Single-frame) detection percentage vs. time Real-time tracking can be achieved re-initializing the swarm in frame F(t+1) within the region where the plate has been detected in frame F(t): average detection time 0.03s (more than 30 fps can be analyzed).
Swarm Intelligence approaches can be very efficient in roughly detecting object positions, as they effectively sample the search space • Very interesting approaches to the analysis of stereo images for obstacle detection and robot navigation have been described by Louchet, Lutton and Olague
UPCOMING BOOK Genetic and Evolutionary Image Processing and Computer Vision Hindawi Book Series in Signal Processing Editors: S. Cagnoni, E. Lutton, G. Olague
UPCOMING WORKSHOP EVOIASP 2008 (part of Evo* 2008) 10th European Workshop on Evolutionary Computation for Image Analysis and Signal Processing Napoli, March 2008 Deadline: 1 November 2007