Download
1 / 37
370 likes | 491 Vues
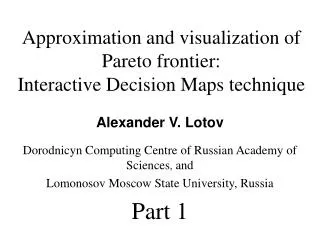
Approximation and Visualization of Interactive Decision Maps Short course of lectures. Alexander V. Lotov Dorodnicyn Computing Center of Russian Academy of Sciences and Lomonosov Moscow State University.

E N D
Approximation and Visualization of Interactive Decision MapsShort course of lectures Alexander V. Lotov Dorodnicyn Computing Center of Russian Academy of Sciences and Lomonosov Moscow State University
Lecture 1. General aspects of decision making. Decision screening. Decision making with multiple objectives Plan of the lecture 1. Main phases of decision making. Decision screening 2. Multi-objective versus single-objective optimization 3. Main concepts of multi-objective optimization 4. Example of Pareto frontier visualization using IDM
Four main phases of decision making(Herbert Simon, 1960) In the book of Nobel prize winner Herbert Simon ‘The New Science of Management Decision', 1960, the decision making process is split into four main phases: intelligence, design, choice and review. Intelligence concentrates on identification of the decision problem and collection of related information. Design is concentrated on developing a relatively small number of decision alternatives that must be studied in details. Choice is related to selecting a decision alternative from the list of alternatives prepared at the design phase. The final phase, review, is actually the phase of implementation of the selected decision and obtaining additional experience in this process. Thus, the decision making is actually split into two stages: • designing a relatively small number of decision alternatives, and • final selecting a decision alternative from a short list.
Main phases of decision making:decision screening and final decision making
Main difference between stages Two stages of the decision making have different features. In the designing stage, selecting a small number of the “interesting” decision alternatives from a large (or even infinite) number of possible decision alternatives (decision screening) is carried out. The procedure can be based on relatively rough models that, however, must be applied to a very broad set of possible decisions. The stage of final selecting is devoted to choice of the best decision alternative from a short list of decision alternatives. The procedure must be based on application of the most precise adequate models and data for the detailed analysis of several alternatives.
The course of lectures is devoted to the new multi-criteria visualization-based technique – the Interactive Decision Maps, which is applied at the first stage of the decision process, namely, for decision screening, i.e. selecting a small number of “interesting” decision alternatives, which will be studied during the final choice. Thus, relatively rough simplified models are applied in our research.
Often, optimization is considered as a tool for decision screening.However, one criterion is not sufficient in various decision problem to describe different interests related to the decision. Say, environmental problems are characterized by at least two criteria – cost and environmental quality. Thus, multi-criteria (multi-objective) methods must be used.Let us compare single criterion and multi-criteria optimization
Single-criterion optimization f(x) = objective function = optimization criterion
Optimization problem.Find Or, find The problem is denoted as
Multi-objective (multi-criteria) optimization However, f(x) = objective vector function, y= criterion vector What does it mean? It means that ‘less’ is better than ‘more’ for all partial criteria. It is not sufficient for selecting the unique decision.
Feasible objective points for water quality improvement projects:cost (F) versus pollution (Z5)
Conclusions: 1) The frontier of the variety of possible outcomes is of interest 2) Decision maker is needed to select “the best” point of the frontier 3) Mathematical methods are needed to construct the frontier.
Examples of decision problems with multiple criteria • Design of environmental projects • Water management • National economic development • Corporate planning • Machinery design (design of airplanes, cars, etc. as well as of their parts) • Etc.
Main concepts of multi-criteria (multi-objective) optimization
Decision maker The decision maker (DM) is a person responsible for the decision making. Usually DM is a convenient abstraction since many different people (advisers, experts, analysts, various stakeholders) influence (or try to influence) the decision. However, the concept of the DM is used in MCDM field.
Mathematically speaking, in minimization problem, the point is better, than the point (dominates the point ) means the following • It means that the criterion points dominated by y’ are given by the non-negative cone with the vertex in the point y’. Slater (weak Pareto) domination
Non-dominated ( Pareto) frontier P(Y) f(X)
Ideal point and Edgeworth-Pareto Hull P(Y) f(X) y*
Objective tradeoffs for two criteria Objective tradeoff is a value that helps to compare two objective vectors. As the objective tradeoff between y1=f(x2)=(y11, y12)and y2=f(x2)=(y21, y22)(assuming y12– y22≠0 ), one understands For any Pareto optimal points y1 and y2, the value T1,2 (y1, y2) is negative because it describes the relation between the improvement of one objective and worsening of another. Tradeoff information is very important for the DM who decides which of these points is more preferable.
Tradeoff rate in the bi-objective case For a Pareto-optimal objective vector y*=f(x*), in which the Pareto frontier is smooth, one can use the tradeoff rate where the derivative is taken along the Pareto frontier. The value of the tradeoff rate informs the DM concerning the exchange between the objective points if one moves along the Pareto frontier.
Objective tradeoffs for multi-objective case (m>2) Let us consider two objectives number i and j for two criterion points y1 =f(x2)and y2=f(x2) (assuming y1j– y2j≠0). The value is said to be the partial objective tradeoff if other objective values are not taken into account. In contrast, it is the total objective tradeoff if y1and y2 satisfy y1k= y2k for all k≠i,j. It is clear that the partial tradeoff does not give multi-objective information for m>2. In contrast, the total tradeoff has more sense but it can only be used for a small part of pairs of decisions.
Bi-objective slices To give a geometric interpretation of the total tradeoff, it is convenient to consider bi-objective slices (cross-sections) of the set Y (or the set Yp). A bi-objective slice of Y is defined as a set of such points in Y , for which all objective values except two (i and j, in our case) are fixed. The slice is a two-dimensional set containing only those pair of criterion points y1and y2, for which it holds y1k= y2k for all k≠i,j. Thus, since only the values of yiand yjchange in the slice, the slice can be displayed in the ( yi, yj)-plane. Then, the tradeoff can be evaluated visually between any pair of points of the slice. Such a comparison is especially informative if both objective vectors belong to the Pareto frontier.
Partial tradeoff rate Application of bi-objective slices is even more important while studying tradeoff rates between objective values. If the Pareto frontier is smooth in its point y* = f(x*), a tradeoff rate becomes a partial tradeoff rate defined as where the partial derivative is taken along the Pareto frontier. Graphically, it is given by the tangent line to the frontier of a bi-objective slice. The value of the partial tradeoff rate informs the DM about the tradeoff rate between values of two objectives under study at the point y*, while other objectives are fixed at some values.
Decision maps A decision map is a collection of bi-criterion slices of the Pareto frontier. It is a tool for visualization of the Pareto frontier in the case of three criteria.
Topic of the course of lectures Interactive visualization of decision maps for informing the decision makers on the Pareto frontier in the case of more than three criteria can be carried out by using a special technique named Interactive Decision Maps (IDM). Description of the IDM technique and its applications is the main topic of the course of lectures.
Computer demonstration: a simple example of regional water planning
The problem The problem of economic development of the region is studied. If the agricultural (to be precise, grain-crops) production would increase, it may spoil the environmental situation in the region. This is related to the fact that the increment in the grain-crops output requires irrigation and application of chemical fertilizers. It may result in negative environmental consequences, namely, a part of the fertilizers may find its way into the river and the lake with the withdrawal of water. Moreover, shortage of water in the lake may occur during the dry season.
Two agricultural zones are located in the region. Irrigation and fertilizer application in the upper zone (located higher than the lake) may result in a drop of the level of the lake and in the increment in water pollution. Irrigation and fertilizer application in the second zone that is located lower than the lake may also influence the lake. This influence is, however, not direct: irrigation and fertilizer application in the lower zone may require additional water release from the lake into the river (the release is regulated by a dam) to fulfill the requirements of pollution control at the monitoring station located in point A .
The model The model consists of three sub-models: • model of agricultural production; • water balances and constraints; • pollution balances and constraints. The production in an agricultural zone is described by a technological model, which includes N agricultural production technologies. Let xij, i=1,2...,N, j=1,2, be the area of the j-th zone where the i-th technology is applied. The areas xijare non-negative and are restricted by the total areas of zones
The i-th agricultural production technology in the j-th zone is described by the parameters aijk, k=1,2,3,4,5, given per unit area, where aij1 is production, aij2 is water application during the dry period, aij3 is fertilizers application during the dry period, aij4 is volume of the withdrawal (return) flow during the dry period, aij5 is amount of fertilizers brought to the river with the return flow during the dry period. Thus, one can relate the values of production, pollution, etc. to the distribution of the area among technologies in the zone where zj1 is production, zj2 is water application during the dry period, zj3 is fertilizers application during the dry period, zj4 is volume of the withdrawal (return) flow during the dry period, zj5 is amount of fertilizers brought to the river with the return flow during the dry period in the j-th zone.
The water balances are fairly simple. They include changes in water flows and water volumes during the dry period. The deficit of the inflow into the lake due to the irrigation equals to z12 z14. The additional water release through the dam during the dry period is denoted by d. It is supposed that the release d and water applications are constant during the dry season. Let T be the length of the dry period. The level of the lake at the end of the dry period is approximately given by L(T) = L (z12 z14 + d)/, where L is the level without irrigation and additional release, and is a given parameter. Flow in the mouth of the river near monitoring point A denoted by vAequals to vA0+(d z22+ z24)/T, where vA0is the normal flow at point A. The constraint is imposed on the value of the flow vA vA*, where the value vA* is given. Thus, the following constraint is included into the model vA0+(d z22+ z24)/T vA*.
The increment in pollution concentration in the lake denoted by wL is approximately equal to z15/ , where is a given parameter. The pollution flow (per day) at the point A denoted by wA is given by z25 /T + qA0, where qA0 is the normal pollution flow. It means that we neglect the influence of fertilizers application in the upper zone on pollution concentration in the mouth. Then, the value of wA equals to (z25 /T + qA0 ) / vA . The constraint wA≤wA* where wA* is given is transformed into the linear constraint (z25 /T + qA0 ) ≤wA* vA or z25 /T + qA0≤wA*(vA0+(d z22+ z24)/T).
Decision variables and criteria The decision variables are allocations of land between different technologies in the agricultural zones as well as the additional water release through the dam. For the criteria, any collection of the variables of the model can be used.
Demonstration of the IDM software:exploration of the formulated problem