Download
1 / 35
350 likes | 539 Vues
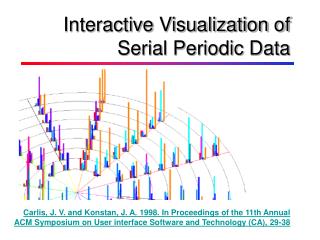
Interactive Visualization of Serial Periodic Data. Carlis, J. V. and Konstan, J. A. 1998. In Proceedings of the 11th Annual ACM Symposium on User interface Software and Technology (CA), 29-38. Los Autores.

E N D
Interactive Visualization of Serial Periodic Data Carlis, J. V. and Konstan, J. A. 1998. In Proceedings of the 11th Annual ACM Symposium on User interface Software and Technology (CA), 29-38
Los Autores Joseph A. Konstan (President of ACM SIGCHI (July 2003 - June 2006) ACM's Special Interest Group on Computer-Human Interaction) • Education • Ph.D. in Computer Science University of California, Berkeley 1993 • M.S. in Computer Science University of California, Berkeley 1990 • A.B. in Computer Science Harvard University 1987 • Professional Experience • Professor (with tenure) University of Minnesota 2005 • Associate Professor (with tenure) University of Minnesota 1999-2005 • Assistant Professor University of Minnesota 1993-1999 • Consulting Scientist Net Perceptions, Inc. 1996-2000 • Instructor University of Minnesota 1992-1993 • United States Patents • U.S. Patent #6,496,832. Visualization Spreadsheet(with E. Chi, J. Riedl, P. Barry). Issued December 17, 2002. • U.S. Patent #6,412,012. System, method, and article of manufacture for making a compatibility-aware recommendations to a user (with P. Bieganski, J. Rauser, and D. Frankowski). Issued June 25, 2002. • U.S. Patent #6,334,127. System, method and article of manufacture for making serendipity-weighted recommendations to a user (with P. Bieganski and J. Riedl). Issued December 25, 2001. • U.S. Patent #6,108,493. System, Method, and Article of Manufacture for Utilizing Implicit Ratings in Collaborative Filters (with B. Miller and J. Riedl). Issued August 22, 2000. • U.S. Patent # 6,016,475. System, Method, and Article of Manufacture for Generating Implicit Ratings Based on Receiver Operating Curves (with B. Miller and J. Riedl). Issued January 18, 2000. • U.S. Patent #5,842,199. System, Method, and Article of Manufacture for Using Receiver Operating Curves to Evaluate Predictive Utility (with B. Miller and J. Riedl). Issued November 24, 1998.
Los Autores Joseph A. Konstan (Prof, University of Minnesota - Computer Science Department) LISTA DE PUBLICACIONES:http://www.informatik.uni-trier.de/~ley/db/indices/a-tree/k/Konstan:Joseph_A=.html
Joseph A. Konstan (President of ACM SIGCHI (July 2003 - June 2006) ACM's Special Interest Group on Computer-Human Interaction)
Los Autores John Carlis is on the faculty in the Department of Computer Science at the University of Minnesota. For the past twenty years he has taught, consulted, and conducted research on database systems, particularly in data modeling and database language extensions. John V. Carlis
Criterios Generales • Pertinencia del artículo • Contribución original • Valor con respecto a otros artículos en el mismo tópico • Adecuado para la audiencia objetivo • Satisface necesidades específicas de usuarios específicos
Abstract John V. Carlis, Joseph A. Konstan: Interactive Visualization of Serial Periodic Data. ACM Symposium on User Interface Software and Technology 1998: 29-38 CONTRIBUCION ORIGINAL PERTINENCIA
Criterios Generales • Pertinencia del artículo • Contribución original • Valor con respecto a otros artículos en el mismo tópico • Adecuado para la audiencia objetivo ACM UIST está enfocado a researchers and practitioners de las áreas: • traditional graphical & web user interfaces • tangible & ubiquitous computing • virtual & augmented reality • Multimedia • new input & output devices • CSCW (Computer supported cooperative Work) • Satisface necesidades específicas de usuarios específicos
NECESIDADES ESPECIFICAS USUARIOS ESPECIFICOS Abstract John V. Carlis, Joseph A. Konstan: Interactive Visualization of Serial Periodic Data. ACM Symposium on User Interface Software and Technology 1998: 29-38
Marco Teórico – Datos Seriales http://www.ers.usda.gov/Data/foodconsumption/FoodAvailQueriable.aspx#midForm
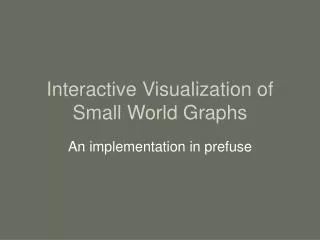
Marco Teórico – Datos Seriales/periódicos? Revisión de trabajos relacionados
Marco Teórico – Datos Seriales/periódicos? Revisión de trabajos relacionados
Trabajos Relacionados -Tabular display of data R. Rao and S. K. Card. The Table Lens: Merging Graphical and Symbolic Representations in an Interactive Focus + Context Visualization for Tabular Information. CHI '94. Demo
Trabajos Relacionados Linear timeline displays Plaisant, C., Milash, B., Rose, A., Widoff, S., Shneiderman, B. Life Lines: Visualizing Personal Histories, ACM CHI '96 Conference Proc. (Vancouver, BC, Canada, April 13-18, 1996) 221-227, color plate 518, http://www.acm.org/sigchi/sigchi96/proceedings.
Trabajos Relacionados Circular line graphs / wind rose graphs Harris, R.L., Information Graphics: A Comprehensive Illustrated Reference. Management Graphics, Altanta, 1996.
Marco Teórico – Datos Seriales/periódicos? Revisión de trabajos relacionados
Trabajos Relacionados Dynamic query systems Christopher Williamson's HomeFinder showed a map of Washington, DC and 1100 points of light indicating homes for sale. Users could mark the workplace for both members of a couple and then adjust sliders to select circular areas of varying radii. Other sliders selected number of bedrooms and cost, with buttons for air conditioning, garage, etc. Within seconds users could see how many homes matched their query, and adjust accordingly. Controlled experiments with benchmark tasks showed dramatic speed-ups in performance and high subjective satisfaction (1, 2, 3) (HCIL TR 93-01and HCIL TR 94-16) (HCIL Video Reports 1993 and 1994). This demo continues to be one of the most compelling and comprehensible even though it is almost 8 years old. Ahlberg, C., Williamson, C., and Shneiderman, B. Dynamic queries for information exploration: an implementation and evaluation. In Proceedings of CHI '92.
Trabajos Relacionados Focus+Context Interfaces Lamping, J. and Rao, R. Laying out and visualizing large tree using a hyperbolic space. In Proceedings of UIST '94.
Trabajos Relacionados Focus+Context Interfaces Robertson, G.R. and Mackinlay, J.D. The document lens. In Proceedings of UIST '93.
Trabajos Relacionados Zooming interfaces Perlin, K. and Fox, D. Pad: an alternative approach to the computer interface. In Proceedings of SIGGRAPH '93.
Trabajos Relacionados Zooming interfaces Bederson, B.B. and Hollan, J.D. Pad++: a zooming graphical interface for exploring alternate interface physics. In Proceedings of UIST '94.
Trabajos Relacionados - Zooming interfaces Rennison, E. Galaxy of news: an approach to visualizing and understanding expansive news landscapes. In Proceedings of UIST '94.
Trabajos Relacionados – Special purpose int. Robertson, Mackinlay, and Card (1991). Cone Trees: Animated 3D Visualizations of Hierarchical Information. Proceedings of the Conference on Human Factors in Computing Systems (CHI'91), pages 189-194. ACM Press
Marco Teórico • Validez • Aplicación apropiada del marco teórico • Revisión de Trabajo previo relevante
Solución Propuesta –Seriales y Periódicos APR MAY MAR JUN FEB JAN JUL AUG DEC SEP NOV
Linea de fin de límite Linea de inicio de límite Solución Propuesta – Boundary Lines
Solución Propuesta • Es la solución apropiada? • Es explicada claramente? • La solución tiene alguna debilidad? • Estudio suficientemente comprensivo y preciso? • Se omitió algo importante en la investigación?
Resultados Viz 3D. de datos Seriales y Periódicos Fig 5. A spiral display of monthly consumption percentages for all 112 foods during the period 1980 –1988.
Resultados – exploración mediante alineación vertical Chi, E.H., et. al. Visualizing the Evolution of Web Ecologies. In Proceedings of CHI 98.
Resultados • Se presentan y describen de manera total y clara • Resultados consistentes • Interpretación de otra forma? • Se ignoran datos que podrían ser importantes? (“solo se utilizan espirales planares, porque las espirales planares dejan una dimensión adicional para visualizar atributos de datos y porque, las espirales no planares no nos han dado ningún display utilizable.”)
Conclusiones • Lógica del punto de vista • Validez de la evidencia • Validez de las conclusiones • Precisión y rigor • Mostrar los datos en espiral permite analizar aspectos claves de información serial y periódica • Las visualizaciones en espiral son una poderosa herramienta comparable a la visualización en árboles (que muestran jerarquías) y en tablas (que muestran datos categorizados en 2 ejes )… o cubos • Los usuarios encuentran estas visualizaciones útiles para extractar información estacional y periódica la cual no es evidente desde otras vistas del conjunto de datos.
Presentación y forma • Organización • Errores tipográficos (Error en citación) • Figuras claras y etiquetas apropiadas? (Los ejes no van etiquetados – meses del año??) • Las leyendas de figuras son suficientemente descriptivas del contenido que describen? (las vueltas de la espiral no se etiquetan, para identificar el año o el intervalo??)