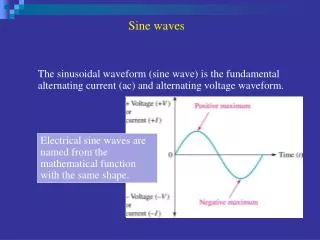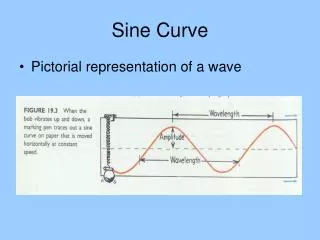
Sine Waves
Sine Waves. Part II: Data Analysis. In the Mode Menu, turn RADIANS on!. Setting Up. Clear any equations or lists from your calculator to start! From the Y= list From STAT lists Turn Stat Plots OFF. Enter the Data. Press the button Choose Edit… to enter the data


Sine Waves
E N D
Presentation Transcript
Sine Waves Part II: Data Analysis
In the Mode Menu, turnRADIANSon! Setting Up • Clear any equations or lists from your calculator to start! • From the Y= list • From STAT lists • Turn Stat Plots OFF
Enter the Data • Press the button • Choose Edit… to enter the data • Enter your data into L1 and L2
Setting up your Plot • To Get into the Stat Plot Menu, press . • Select Plot1 • Press enter on ‘On’
Graphing Your Stats • Press ZOOM • Choose ZoomStat (9) – this will change your window settings to fit all of the data in AND graph it!
Fitting an Equation (This is called a sinusoidal regression) • Press the button and cursor over to the Calc menu • Cursor down to C:SinReg • Press Enter • Enter the list names that contain your data, separated by a comma (For L1 press ) • To tell it where to store the equation, press for Y-Vars and then for functions, and then choose Y1 • Press Enter
Press Graph! Now that you’ve got a curve of best fit, you no longer need the data. Turn the stat plot OFF ( to get into the stat plot menu) and then press again. Now you are ready to answer questions about your graph!