Category Management and SKU Optimization Roundtable
110 likes | 125 Vues
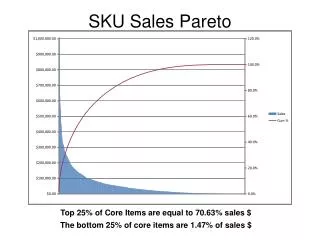
Explore category management and SKU optimization tactics in the retail industry, insights from 2010 launch challenges, and financial trends impacting consumer behavior.

Category Management and SKU Optimization Roundtable
E N D
Presentation Transcript
Category Management and SKU Optimization Roundtable Spencer Baird Senior Director of Category Strategy Kellogg Sales Company
Remembering the Inputs that Launched 2010 into a Chaotic Place. A Correction is Usually That of Bad Behavior, Right? Source: Pew Research July 2010 Per Capita Savings Down to $613/Year In 2007 Versus $2,426/Year in 1982 Net Worth Per HH in US $600,000 in 2007 Average Debt per HH $128,134 55% of American Workers Impacted With Reduction/Loss; 41% of Whites, 78% African American & 70% Hispanic S&P Loses 51% & Home Prices Down -4% ’07 v ‘09 Average Debt per HH $86,346 Net Worth Per HH in US Drops -24% In 2008 Per Capita Spending in the US Drops $16/week Compared to ‘07 81% of African Americans & 75% of Hispanics Say That US is Land of Prosperity Saving as % of Income Rises To 4% from 2% in ‘07 2000 2007 2009 2010 2011
The Majority of Financial Change was the Result of our Reaction to Uncertainty…Rather than Actual Consumer Uncertainty.
Learning #1. The balance of focus between “who we are” versus “who we are not” was off kilter.
Shining Star Retailer in the US in 2010. Share of Market Realities. 2010. One Retailer. Shining Star. Near Double Digit Total Edible Sales % Change. 2 Weeks. Full Share Point Gained. 2 Weeks. Full Share Point Lost.
Learning #2. We Lost Touch with the Reality that the World of Packaged Goods is Zero Sum…and Has Been.
Zero Sum. Defense. We “Uncertain’ed” Ourselves to a Slow Top-Line Death. Top 10 Categories. Total Edibles. 5 Inflated. +1% Sales Growth. 5 Deflated. -2% Sales Growth. Next 20Categories. Total Edibles. 8 Inflated. +4% Sales Growth. 12 Deflated. 0% Sales Growth. *Source. IRI Total Edibles. 2010.
Learning #3. Without Intention, Results are Merely an Accident.
Results. Accidental or Intentional. Yesterday. 50 Priorities Funneled Down Tomorrow. New Process. 3-4 Priorities – Full Activated 1. 2. Everything is a Focus 1-3 Prioritized Focus Areas 1 100 1 100 Results are an Accident Results are Intentional Focus Focus Action Actions
Governing Results. 5 Key Acknowledgements Based on a Better Link to Reality. Clarity is the Nemesis of Chaos. Without Vision, Strategy is Impossible. Answers Aren’t the Issue….Questions Are. Don’t Ask Microsoft to Build Powerpoint Slides. Game Change is +1%.
5 Bias Points for the Future of Managing a Category Organization. Govern, Don’t Manage. Scorecard Everything. Make Compliance Bonus Eligible. Manage Space Top-Down. Embed Loyalty Data. Scrutinize and Reward Presentation of Intention.