Enhancing Educational Technologies for Diverse Learning Styles
250 likes | 262 Vues
Explore the need for improved assessment strategies reflecting individual learning styles in educational technology. Discover how different performance scores and student learning styles are crucial for effective teaching. Gain insights into the impact of various assessment variables on student performance, with a focus on incorporating diverse methodologies to enhance learning outcomes.

Enhancing Educational Technologies for Diverse Learning Styles
E N D
Presentation Transcript
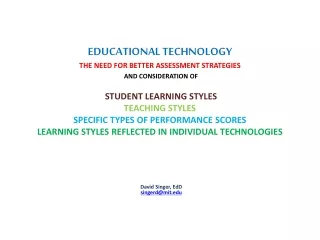
EDUCATIONAL TECHNOLOGY THE NEED FOR BETTER ASSESSMENT STRATEGIES AND CONSIDERATION OF STUDENT LEARNING STYLES TEACHING STYLESSPECIFIC TYPES OF PERFORMANCE SCORESLEARNING STYLES REFLECTED IN INDIVIDUAL TECHNOLOGIES David Singer, EdD singerd@mit.edu
(The following slide was added to clarify the power point presentation that was actually made ) Every human has his or her own unique set of learning styles. These learning styles reflect neurophysiological differences that are measurable. Further, they directly impact the effort and attention necessary to learn any given task. To demonstrate this we can take just a few examples that will reflect this among the audience members today.
MAP DIRECTION PREFERENCES DIRECTIONS WITH MAP NO PREFERENCE DIRECTIONS WITH TEXT (Spatial representation of information) (Textural representation of information) 0_____10_____20_____30_____40_____50_____60_____70_____80_____90_____100 PRETTY PRETTY MUCH MOSTLY A LITTLE EQUAL A LITTLE MOSTLY MUCH ONLY ONLY
(The following slide was added to clarify the power point presentation that was actually made ) The Stoop Effect demonstrates the differences between individuals in their ability to discriminate visual color input into their brains and textual input into their brains. Each source of sensory input reflects distinct neural circuits and corresponding learning styles
Evaluations of the assessment strategies used for educational technologies reveal that little empirical evidence exists that is convincing. • Controlled studies using empirical methods that are the framework of psychology and the hard sciences are not common in education. • Advances in psychology, child development, and neuroscience all point to the need to include additional assessment variables. • These include student learning styles, teaching styles, specific performance scores, and the learning styles reflected in the actual software or hardware product.
There is a not a generally well accepted • definition of what constitutes learning in • education! • The types of performance scores that a student must obtain in • order to receive a given grade vary dramatically across schools • and campuses. • Tests, quizzes, midterms, finals, homework, projects, class • participation, etc. have been combined in motley ways • to determine how much a student has “learned.” • However, each type of performance score can reflect a • different type of learning, and each can correlate differently with • the software or hardware that has been used.
Assessment usually only deals with the mean change in students’ attitudes or performance. • Students who perform worse than or better than the mean have not been differentiated. • We can ask, for instance, what effect a new educational • technology might have for students who might otherwise score near or at the top of their class. • On the other hand, it is likely that an educational technology could benefit students who might otherwise do poorly, have a learning disability, a specific learning style, or who might be unmotivated.
Less than 10% of evaluations or research on the effect of educational technologies focuses on quantitative measures of student learning or performance • More than 90% of the evaluations or research bases its conclusions only on student and teacher opinion surveys and anecdotes. • These are rarely reliable or valid assessment measures upon which they are based
Popular teaching methods such as collaboration, • interaction and hands-on learning methods may • not be effective for all students and may be • counter productive for some. • As a result, software that incorporates such methodologies may • benefits students differently. • On the other hand, specific educational technologies may be • especially beneficial to certain students. • Because of different learning and personality styles, educational • technology effects student performance differently.
Improvements in learning often • cannot be attributed to the • technologies being used in school • Research involving educational technology has historically been very poor because of the lack of methodological controls • All are surmountable – It isn’t that hard!
Once methodologies and technologies are in place, it can get harder to apply them consistently. • It is a common problem that instructors fall back on old • habits or teaching methods before the school term over – • It’s human.
Student motivation to try a new pedagogy can decrease the validity of the findings. • The so called “novelty effect” increases student • motivation and does not address the real question • regarding the effectiveness of the educational • technology.
An important factor in considering how • effective educational technologies • are concerns the amount of time that • they are used within the school setting, • or after school, or at home. • Few schools consider the amount of time that specific • technologies are actually used, or available to students, • or the different students who use them when they try • to assess the benefit of the technologies that they • purchased
HOW DO YOU KNOW THAT AN EDUCATIONAL PRODUCT WORKS? • GENERAL: Define “WORKS” Behavior Opinion Performance • SPECIFIC: Define Teaching and Learning Styles • HAVE A CONTROL GROUP : Many types. All will vastly improve • assessment. Examples: Split-Half. Different classes/same • teacher • USE QUANTITATIVE PERFORMANCE MEASURES. Standardized • tests are best but can include subjective grading as long • as teacher uses blind control • DO STATISTICAL ASSESSMENT • SOME SUPERVISION • MINIMIZE NOVELTY EFFECT
LEARNING STYLES • Each theory of learning styles (all 30-50 different ones) assumes that there are corresponding basic, inborn characteristics of the brain that reflect the categories described • Very assessable to brain-based investigation via fMRI, PET, MEG research • Each child probably has some degree of every kind of learning style described • It is likely that the relative abilities with respect to any learning style reflects a normal distribution, i.e. a bell curve • A child’s interactive experiences can modify, inhibit, augment the inborn learning styles • Given free choice and open opportunity, children will adapt to their world based upon their learning styles with preference given to the learning styles that are dominant • To the degree that children are given predetermined methods of learning, they will adapt with varying degrees of success or failure • All reflect the adjustment to the form of sensory input and are observable by the form of motor output • All learning styles reflect some form of processing that relates to abstract conceptualizations, intuition, reflection, etc.
Teaching Styles Teachers teach in different ways. Over several semesters we evaluated the teaching styles of fourteen professors at MIT. We wanted to observe a representative sample of categories that might describe different styles of teaching. For instance, some professors are almost pure lecturers. Others spend a significant amount of class time answering students’ questions or asking questions. Some professors emphasize new material not available in the textbooks the students buy. Others tend to emphasize review type teaching. Some use many slides and other media sources. Others do not. In addition, the basis for grading a student can vary widely among professors (Singer, D.A., Schneider, G, Microsoft, iCampus Report, Massachusetts Institute of Technology, Cambridge, MA, 2006).
(The following slide was added to clarify the power point presentation that was actually made) Among children, the “Bell Curve” probably represents the distribution of performance of any learning style that we might describe. As such, we must consider this when we design and assess any new educational technology.
DISTRIBUTION OF TEACHING STYLES IN VARIOUS EDUCATIONAL SOFTWARE PROGRAMS ACADEMIC Aural – Visual/Text 0% - 50% Aural – Visual/Spatial 0% -100% Aural – Real world applications 0% - 50% Visual only 0% - 100% AFFECTIVE Aural/Positive Reinforcement 0% - 100% Visual/Positive Reinforcement 0% - 100% TESTING Fill-In (Recall) 0% - 25% Multiple Choice (Recognition) 0% - 100% Comprehension 0% - 75% Hints 0% - 100% Immediate short-term memory 0% - 100% Delayed short-term memory 0% - 60% Timed 0% - 100%
Conclusion: Assessment and Application • The use of educational technology is here to stay. There now exist an estimated 30,000 to 40,000 educational software and hardware products to choose from. • Every year we already spend many billions of dollars to develop, sell and incorporate educational technologies in education. • Billions more are spent trying to develop new learning environments and teaching methods to help students. • The hit-and-miss approach that now predominates wastes time, money and effort. In addition, the results are questionable • There is no reason to avoid undertaking more empirical assessment efforts in order to determine how they might best be used for students.. • Educational technologies offer us the opportunity to address the unique learning styles of every student. • In order to do this we should and can incorporate student learning styles, teaching styles, specific performance scores, and the learning styles reflected in the actual software or hardware product. • At the rate that we are uncovering the workings of our nervous systems, and as we recognize that it is an inescapable truth that each child has a unique set of learning styles, there is no reason that educational hardware and particularly educational software cannot be created to customize education for every student.
SHOULD EDUCATION BE CONSIDERED A SOFT SCIENCE ANYMORE?