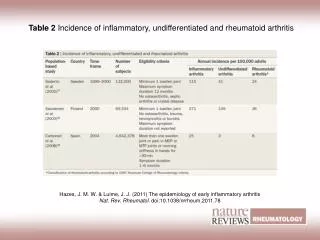
Analysis of Differential Gene Expression and Restriction Enzyme Accessibility in Supplemental Figures
This document provides a comprehensive analysis of differential gene expression using various supplemental figures and tables. It outlines the methodologies involving RT-PCR, ChIP analysis, and mononucleosome survey techniques, including the specific primer pairs used. The resulting data illustrates changes in gene expression over time, the impact of different treatment conditions, and provides insights into chromatin accessibility. Detailed information on restriction enzyme accessibility is also presented, allowing for further understanding of the regulatory mechanisms involved.

Analysis of Differential Gene Expression and Restriction Enzyme Accessibility in Supplemental Figures
E N D
Presentation Transcript
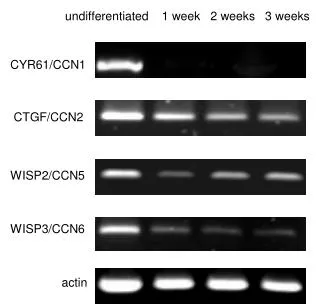
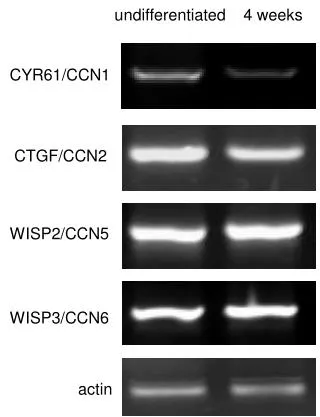
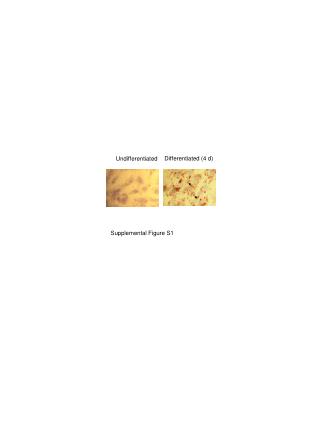
Differentiated (4 d) Undifferentiated Supplemental Figure S1
TRE GC box Supplemental Figure S3
A a b c d e 8 d N5 N4 N3 N2 N1 0 d ApaI XhoI PstI SmaI ApaI f g h i PstI ApaLI PstI SpeI B a/b Xho1 a/c N5 a/d N4 Pst1 N3 a/e Sma1 f/g N2 Spe1 f/h N1 ApaL1 f/i 0 2 4 6 8 0 2 4 6 8 Mock Mock Diff. (d) Diff. (d) Supplemental Figure 4
A Diff. (days) N4 N5 8 N3 N2 N1 N-1 6 4 2 0 e a n g o b k h f p c l i q d m -1.0 kb -0.5 kb + 1 XhoI PstI SmaI SpeI ApaLI TRE GC boxes B H2O 0 2 4 6 8 H2O 0 2 4 6 8 Diff. (d) a j b k N5 j c N2 l d m e N4 n f N1 o g p h N3 N-1 q i Supplemental Figure S5
Table S1. Primer pairs for RT-PCR Table S2. PCR primers for ChIP analysis S and AS represent for sense and antisense sequence, respectively.
Table S3. PCR primers for restriction enzyme (RE) accessibility test in Supplemental Figure S2 S and AS represent for sense and antisense sequence, respectively.
Table S4. PCR primers for mononucleosome survey in Supplemental Figure S3