Download

1 / 26
260 likes | 331 Vues
This chapter explores various methods for assessing document relevance and optimizing feedback in information retrieval systems. It delves into the complexities of user preferences, prototype document recognition, and nonmetric feedback scales. The text discusses how relevance feedback can be crucial in search engine performance evaluation and offers insights on query refinement through centroid computation. Additionally, it presents innovative research ideas such as adaptive document modifications and weight propagation for enhancing retrieval outcomes.

E N D
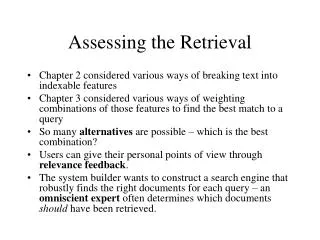
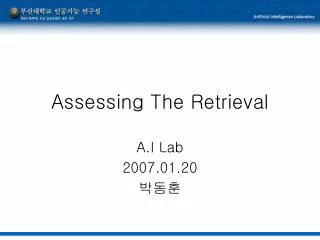
Assessing the Retrieval • Chapter 2 considered various ways of breaking text into indexable features • Chapter 3 considered various ways of weighting combinations of those features to find the best match to a query • So many alternatives are possible – which is the best combination? • Users can give their personal points of view through relevance feedback. • The system builder wants to construct a search engine that robustly finds the right documents for each query – an omniscient expert often determines which documents should have been retrieved.
Personal Assessment of Relevance • What is relevance? The lack of a fully satisfactory definition of the core concept (e.g. relevance, information, intelligence) does not entirely stop progress. • How thorough a search does the user wish to perform? A single football result, or any science that might cure a patient / all previous relevant court cases. This variability can be observed across different users, and even across the same user at different times.
Prototypic retrievals • Relevance feedback (Oddy) is a task of object recognition • The object to be recognised is an internally represented prototypic “ideal” document satisfying the user’s information need. • For each retrieved document, the users have to judge how well it matches the prototype. • We assume that users are capable of grading the quality of this match, e.g. on a five-point scale: not_relevant, no_response, possibly_relevant,relevant, critically_relevant. • Extreme judgements are most useful for relevance feedback.
Relevance Feedback (RF) is Nonmetric • While users find it easy to critique documents with + (relevant), # (neutral), - (not_relevant), they would find it harder to assign numeric quantities reflecting the exact degree of relevance. • E.g. If the best document was rated 10, the second 6 and the third 2, could we be sure that the difference in relevance between the best and the second was exactly the same as the difference between the second and the third? • Types of scales: • Ratio (2 metres is twice as long as one metre) • Interval (gap between 30 degrees and 20 degrees is the same as the gap between 20 degrees and 10 degrees – but 20 degrees is not exactly twice as hot as 10 degrees) • Ordinal e.g. + > # > - in RF • Nominal: separate unranked categories e.g. noun, verb, adjective.
Extending the dialogue with RF • In RF, users’ reactions to just retrieved documents provide the link between assessments, to form the FOA search dialogue. • Do we assess retrieval performance according to which documents come out first time around, or after a number of iterations of “berrypicking” (Bates, 1986). • It seems that in reality an assessment of one document’s relevance will depend greatly on the “basket” of other documents we have already seen – but IR uses the independence assumption
Using RF for Query Refinement (1) • We expect that there is some localised region in vector space where + relevant documents are most likely to occur. • If these positively rated documents are in fact clustered, we can consider a hypothetical centroid (average) document d+, which is at the centre of all those documents the users have rated relevant. • To calculate the centroid, e.g. consider a vocabulary of [apple, bean, carrot] • Let doc_vector1 be [1, 0, 0] • Let doc_vector2 be [2, 1, 0] • Let doc_vector3 be [1, 1, 0] • Then d+ = [1.33, 0.67, 0] • It is less reasonable to imagine that negatively labelled documents are similarly clustered.
RF for Query Refinement (2) • Most typically, RF is used to refine the user’s query – we “take a step toward” the centroid of the positively rated cluster d+ • The size of this step can vary, e.g. half the distance between the original query and d+ • E.g. d+ = [1.33, 0.67, 0] • Original_query = [ 1, 1, 1 ] • New_query = [1.17, 0.83, 0.5] • Negative RF involves “taking a step away from” the centroid of the negatively rated documents, but this works less well due to the cluster being less well defined.
RF: Research Ideas • 1. Make changes to the documents rather than the query (see next slide). Adaptive document modifications made in response to RF are not expected to be of (immediate) use to the users who provide it, but made available to later searchers: useful documents have been moved slowly into that part of the semantic space where users’ queries are concentrated (Salton & McGill, 1983) • 2. Weight propagation (Yamout, two slides away).
Documents Propagating Positive and Negative Weights (Fadi Yamout, 2006)
Search Engine Performance • We have discussed RF from the user’s point of view and how this information can be used to modify users’ retrievals. • Another use of RF information is to evaluate which search engine is doing a better job. • If one system can consistently, across a range of typical queries, more frequently retrieve documents that the users mark as relevant and fewer that they mark as irrelevant, then that system is doing a better job.
Underlying assumptions • Real FOA vs. laboratory retrieval. Our lab setting is similar to real life, i.e. “guinea pig” users will have reactions that mirror real ones. • Intersubject reliability = consistency between users. But users differ in education, time available, preferred writing styles, etc. See consensual relevance, Kappa statistic. • The relevance of a document can be assessed independently of assessments of other documents – a questionable assumption • We are assessing the document proxy rather than the document itself.
Traditional Evaluation Methodologies • When text corpora were small, it was possible to have a set of test queries compared exhaustively against every document in the corpus. • E.g. the Cranfield collection:1400 documents in metallurgy, with 221 queries generated by some of the documents’ authors. • The Text Retrieval Conference is held annually for search engine evaluation. It uses much larger corpora, and avoids exhaustive assessment of all documents by the pooling method. • The pooling method uses each search engine independently, and then pool their results (top k documents, where k = 100) to form a set of documents that are at least potentially relevant. • All unassessed documents are assumed to be irrelevant.
Recall and Precision: A reminder • Recall = | Ret ∩ Rel | / | Rel | • Precision = | Ret ∩ Rel | / | Ret |
Notes on the recall/precision curves • 4.10 top ranked doc relevant, second relevant, third non-relevant etc. • 4.11 dotted line shows what would happen if top ranked doc non-relevant, second and third relevant (i.e. swap the judgements for the top and third-ranked documents relative to 4.10. • 4.12. Best retrieval envelope would be achieved if the top 5 ranked documents were all relevant, all lower-ranked documents non-relevant. • 4.12 Worst retrieval envelope would be achieved if the top ranked documents were al non-relevant, and the 5 lowest-ranked documents were all relevant.
Multiple retrievals across a set of queries • 4.14 shows R/P curves for two queries. • Even with these two queries, there is no guarantee that we will have R/P data points at any particular recall level. • This necessitates interpolation of data points at desired recall levels, e.g. 0, 0.25, 0.5, 0.75 and 1. • The 11-point average curve finds the average precision over a set of queries at recall-levels of 0, 0.1, 0.2, 0.3, 0.4, 0.5, 0.6, 0.7, 0.8, 0.9 and 1. • Another useful measure for web search engines is P@10, the precision over the top 10 ranked documents.
Combining Precision and Recall • Jardine & Van Rijsbergen’s F-measure • The “harmonic mean” of Precision and Recall • F = (2 * P * R) / (P + R).