Download
1 / 109
1.09k likes | 1.12k Vues
CoCoRaHS is a grassroots, high-density precipitation network made up of volunteers of all backgrounds and ages. Volunteers take daily measurements of precipitation such as rain, snow, and hail right in their own backyards using low-cost measurement tools. They report their observations on the interactive website www.cocorahs.org. CoCoRaHS aims to provide high-quality data for natural resource, education, and research purposes. This training slide show covers how to set up and use the measurement equipment effectively to ensure accurate data collection.

E N D
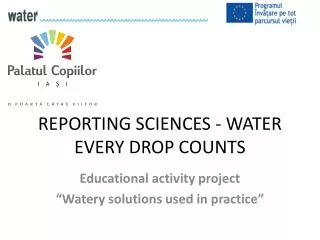
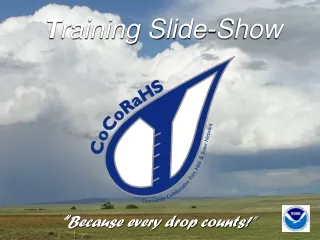
Training Slide-Show “Because every drop counts!”
What Is CoCoRaHS?? made up of volunteers of all backgrounds and ages . . . “CoCoRaHS is a grassroots, non-profit, community-based, high-density precipitation network . . . who take daily measurements of “just precipitation” right in their own backyards”
We just measure precipitation! Rain Snow Hail
Once trained, our volunteers collect data using low-cost measurement tools . . . Aluminum foil-wrapped Styrofoam hail pads 4-inch diameter high capacity rain gauges
and report their daily observations on our interactive Web site: www.cocorahs.org
Our aim isto provide the highest quality data for natural resource, education and research applications.
WHY CoCoRaHS ? Five Important Reasons 5
2) Data sources are few and rain gauges are far apart 1) Precipitation is important and highly variable PRISM: used by permission 3) Measurements from many sources are not always accurate (especially snow) 4) There is almost no quantitative data being collected about hail
National Weather Service Other Meteorologists Hydrologists Emergency Managers City Utilities -Water supply -Water conservation -Storm water Insurance adjusters USDA—Crop production Engineers Scientists studying storms Mosquito control Ranchers and Farmers Outdoor & Recreation Teachers and Students Geoscience education tool Taking measurements Analyzing data Organizing results Conducting research Helping the community Who uses CoCoRaHS Data?
Who Sponsors CoCoRaHS? The National Oceanic and Atmospheric Administration Colorado State University USDA US Bureau of Reclamation National Weather Service Local Offices Individual Contributors As well as many others
SECTION ONE: Observer Information • In this section we will: • a) Explain what we will need from you before you • become an observer • b) Explain what you will need before you can participate
a) What we will need from you before you can participate as an observer:
Your willingness to receive CoCoRaHS e-mails A completed application form(on-line or paper) Your location – so we can produce accurate maps. Just having your address may not be good enough. We have to pinpoint it just as close as we can. (spam blocking off) info@cocorahs.org cocorahsqc@msn.com nolan@atmos.colostate.edu Your commitment to collect accurate scientific data
b) What you will need before you can participate as an observer
#1 #3 A unique station number and name (we will assign you one) A sincere desire to help study and learn about storms #2 Station Number : CO-LR-368 Station Name : FCL 3.4 SW Training (In person or on-line)
A CoCoRaHS “4-inch” rain gauge installed in a good location #4 #5 A login ID and password to enter data
Hail pads (some states may not be participating) #6 #7 Internet or telephone capabilities The ability to gather accurate data and transmit it in a timely fashion
SECTION TWO: Setting Up Your Equipment and Observing Precipitation • In this section we will: • a) Show how/where to place your gauge and hail pad • b) Explain how to measure rainfall • c) Illustrate how to observe hail • d) Show how to measure snow depth and • water content
a) Placement of your rain gauge Location is the key to good data! Location! Location! Location!
Places not to place your gauge Using your gauge to hold up your gutter downspout is not a wise choice either! The #1, all time worst place to put your rain gauge is to leave it in the box!
Avoid placing it under trees or any structure Although convenient, the deck is still too close to the house
Also avoid placing your gauge near: Sprinklers (both big and small) Steep slopes (a bit exaggerated) Animals (dogs, birds, etc) mountain lions?
And finally avoid anything that would artificially increase or decrease your gauge catch Wind Such as a solid fence This can cause updrafting during strong winds, which may reduce your gauge catch
Ideal placement of your gauge Photo by M. Suedukum
Distance from obstacles • In open areas strive to be twice as far from obstacles as they are high. • In developed areas strive to be as far from obstacles as they are high.
Distance between Trees Ideally, place your gauge equidistant from the nearest trees
Height above the ground In open areas place the gauge top approx. 2 feet off the ground This is to improve gauge catch by reducing wind speed 2 feet In developed areas place the gauge top approx. 5 feet off the ground This is to improve gauge catch by reducing the impact of nearby obstacles 5 feet
LEVEL and BEVEL Make sure your gauge is level Bevel the top of the post to reduce rain splashing into the gauge.
Where should I place my hail pad? When you’ve found a good place for your rain gauge, that should be good enough for your hail pad as well.
Elevate and Attach The pad must be horizontal. It is best, but not necessary, to elevate the hail pad. It should also be firmly attached so that . . .
. . . it doesn’t blow away! “When last seen, our hail pad was headed north at 3rd and Elm”
Spraying the pad If you have trouble with birds, lightly spray paint the hail pad surface with a dull color* * Bright Orange may not be the best choice . . . but it may keep hunters from shooting your pad.
Write the direction the pad is facing on the pad’s back This example shows an “N” for North
When should we read our gauges? 7:00AM is preferred Between 5:00AM and 9:00AM is OK Other times are accepted, but they will not appear on CoCoRaHS Maps Photo by Henry Reges
Reading your rain gauge • Reading the rain gauge is easy but accuracy & consistency are important. • Here are the most common situations you may encounter when reading your gauge.
Your most common observation 0.00 . . . will bezero, (0.00), nada, nothing, zilch! It is important to know that it did NOT rain. Please report zeros!
Trace “T” When only a drop or two wet the gauge record a “T” for Trace T
Between “T” and “one tenth” of an inch That’s 0.04 or four hundredths
The surface of the water in the gauge looks curved. How do I know where to read? As water fills up the measuring tube, a curved surface is formed called a meniscus. This meniscus is formed by the surface tension of a liquid in contact with the sides of the tube. Always read the bottom of the meniscus, when the making your daily rain measurements.
A nice soaking rain This is “one half” inch it’s . . . NOT 5.0, nor 0.05, but 0.50 (kind of like 50 cents out of a dollar) 0.50
A good rain The inner tube holds 1.00 inch 1.00
DECIMALS Getting the decimal point correct is ESSENTIAL 0.40” There is a large water difference between 0.40 inches and 4.00 inches Photo by Henry Reges
Water! Water! Everywhere! When more than an inch of rain falls the precipitation will overflow into the outer cylinder. The whole gauge has a capacity to hold 11 inches.
To measure greater than one inch . . . Pour out the first inch from the inner tube and write it down. Now pour the remaining water into the funnel & measure using the inner tube.
Then add up all of your measurements 1.00 inch + 0.97 inches + 0.88 inches +0.92 inches = 3.77 inches Continue until all of the water has been measured. Make sure you keep track of your amounts along the way. Total = 3.77”
As hail is falling Three steps in Observing hail #1 Fill out your CoCoRaHS Hail Report Card. After the storm is over attach it the back of the pad.