Download
1 / 19
190 likes | 347 Vues
QPF verification of LAMI. F. Grazzini, M. S. Tesini, P. Mezzasalma. Forecasting Section ARPA-ServizioIdroMeteorologico Emilia-Romagna fgrazzini@arpa.emr.it. Outline. Box verification (Tesini) Weather dependent verification (Mezzasalma). Box verification (0.4°x0.4°) over N-Italy.

E N D
QPF verification of LAMI F. Grazzini, M. S. Tesini, P. Mezzasalma Forecasting Section ARPA-ServizioIdroMeteorologico Emilia-Romagna fgrazzini@arpa.emr.it
Outline • Box verification (Tesini) • Weather dependent verification (Mezzasalma)
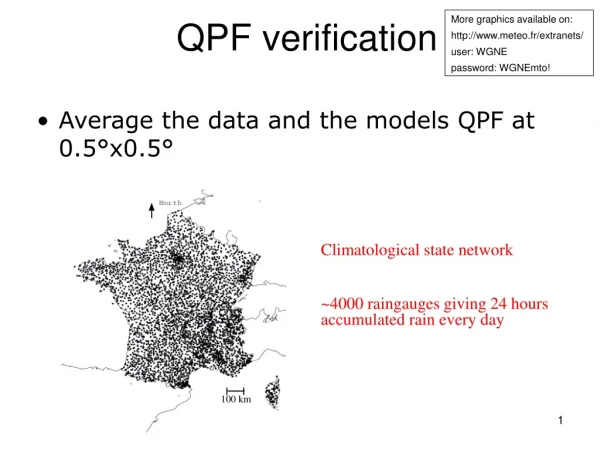
Box verification (0.4°x0.4°) over N-Italy Only grid-points surrounded by obs are considered
LamiN OPE (35 lev, Nudging) vs LamiP (OPE+prognostic precipitation)
MED Soglia 1 Soglia 10 Nobs ~ 700 Nobs ~ 80 Soglia 5 Soglia 20 Nobs ~ 200 Nobs ~ 25
MED Soglia 1 Soglia 10 Nobs ~ 120 Nobs ~ 900 Soglia 5 Soglia 20 Nobs ~ 25 Nobs ~ 300
MED Soglia 1 Soglia 10 Nobs ~ 120 Nobs ~ 12 Soglia 5 Nobs ~ 40
Weather dependent verification over Emilia-Romagna warning areas • Since Autumn 2003 • Average of precipitation over homogeneous areas • Direct feedbacks on the operational interpretation of model output
8 6 4 7 5 3 2 1 Emilia Romagna’s warning areas River Po Adriatic sea M. Cimone ^ 2173 m Each area contains ~30 LAMI grid points ~3000 Km2
Area average precipitation over warning areas, mm/24h, 2003-2005
Area average precipitation over warning areas, mm/24h, 2003-2005
Area average precipitation over warning areas, mm/24h, 2003-2005
strong events with area average precipitation over a warning area > 20 mm/24h
Precipitation bias with SW wind at 700 hPa > 10 m/s -20% -20% -62% -62%
Precipitation bias with NE wind at 700 hPa > 10 m/s 33% 33% 17% 17% N.B. Only one year of data