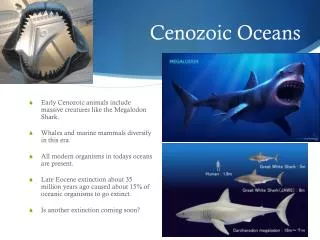
Cenozoic
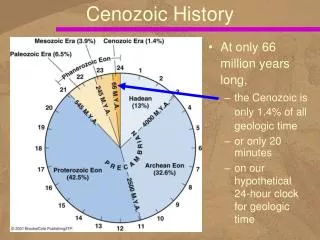
Cenozoic. Geology. Cenozoic Introduction. Tertiary (66-1.6 Ma) Paleocene Eocene Oligocene Miocene Pliocene Quaternary (1.6 Ma-present) Pleistocene Present Earth features are Cenozoic. Cenozoic Plate Motions. Atlantic Ocean continues to widen India to Asia Himalayas

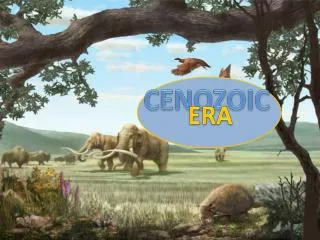
Cenozoic
E N D
Presentation Transcript
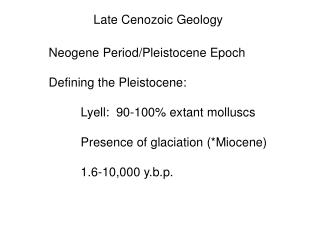
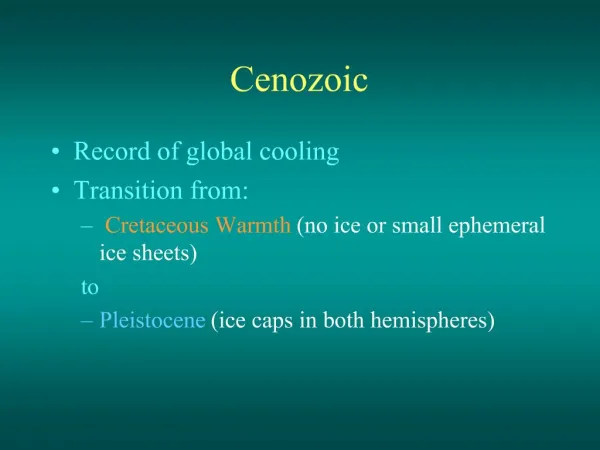
Cenozoic Geology
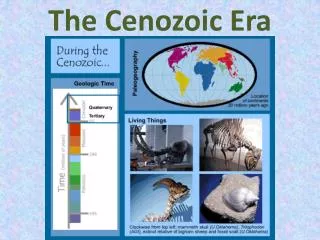
CenozoicIntroduction • Tertiary (66-1.6 Ma) • Paleocene • Eocene • Oligocene • Miocene • Pliocene • Quaternary (1.6 Ma-present) • Pleistocene • Present Earth features are Cenozoic
Cenozoic Plate Motions • Atlantic Ocean continues to widen • India to Asia • Himalayas • Africa moves northward • Mediterranean Sea • E. Africa Rift zone born • Australia & Antarctic separate • North America & Greenland split from Europe • Farallon Plate subducted
CenozoicMountain Building • 2 zones of orogenesis • Alpine-Himalayan Belt • Circum-Pacific Belt
Alpine-Himalayan Belt • Began during Mesozoic • Most deformation Eocene to L. Miocene • Africa-Arabian Plate hit Eurasia • India collided with Asia • Himalayas • Collision of Spain with France • Pyrenees, Alps, Apennines, Atlas Mtns. Evolved
HimalayasIndia-Asia X-section • Birth of Himalayas • Maybe evolved 40 to 50 Ma • Decreased spreading rates (15-5cm/yr) • 2000 km of India beneath Asia
Swiss Alps • Alps showing Nappes • Large, faulted overturned folds
Circum-Pacific Belt • Arc orogens – oceanic crust subducted • Philippines, Japan, Aleutians form • Andes form – Nazca & Cocos plate subducted • Central America Arc connection develops
Japan Evolution • Sea of Japan thought to have formed by back-arc spreading
Andes Evolution • Passive margin changed to active margin • Followed by continued deformation
North America Cordillera • Complex mountainous region • Extends from Alaska to Central Mexico • Laramide orogeny (Late K-Tertiary) • Intrusive and Extrusive volcanism • Extension Basin & Range • Uplift & Erosion Colorado Plateau
Laramide Orogeny • Begins in Cretaceous • Caused by subduction of Farallon plate beneath North America • Orogenesis of Rocky Mtns. • Ends in middle Miocene
Laramide Orogeny • Little volcanism or pluton emplacement • Uplift is vertical • Little compressional folding/faulting • Angle of subduction decreases • Arc Magmatism shifts inland • Farallon subducted along with mantle plume • Deformation occurs further inland
Cordilleran Volcanism • Continuous through Cenozoic • Varied Eruptive Styles & location • Columbia Plateau • Cascade ranges
Columbia River Basalts Flood Basalts • Tertiary Extrusive Volcanism • Eocene lavas in Yellowstone • Oligocene tuffs, flows, calderas—Colorado • Pliocene to Quarternary volcanism—San Francisco Mtns. • Columbia River basalts—Pacific Northwest • Issued from long fissures • One flow covers 40,000 km2 • May result from hot spot • Flow young to northeast Old Faithful
Cascade Ranges • Built by andesitic volcanism during Pliocene, Pleistocene, & Recent Mount St. Helens Crater Lake Mount Lassen
North AmericaBasin & Range • Tensional forces caused crustal extension—Nevada mostly • Crustal blocks moved up and down on normal faults
Basin & RangePossible Causes Subduction of East Pacific Rise • Mantle plume • Back-arc spreading
Colorado Plateau • Deep canyons, broad mesas, volcanic mtns • Near sea level – Cretaceous • Deposition of Red Beds • Early Tertiary • No deep canyons • Late Tertiary uplift and erosion • Deposition ceased • Erosion of canyons began
Pacific CoastSan Andreas Fault • Results from Pacific-Farallon ridge collision with North America • Subduction ceased • Continental margin bounded by transform fault • Continued subduction – Juan de Fuca & Cocos plates • Continued volcanic activity in Cascades and Mexico
Quaternary Pleistocene
Cenozoic • Tertiary (66-1.6 Ma) • Paleocene • Eocene • Oligocene • Miocene • Pliocene • Quaternary (1.6 Ma-present) • Pleistocene
QuaternaryPleistocene Epoch • The Ice Ages include glacial and interglacial periods • Glacials • Widespread ice • Interglacials • Less ice • Today’s climate
PleistoceneIce Age • The last glacial maximum • 30% of Earth covered with ice • Sea level was about 100 m (300 ft) lower than today
Ice Age Erosional Evidence • Yosemite Valley • U-shaped valley • Hanging valleys (glacial tributary) • Striations • grooves • Abrasions • smooth, polished surface
Ice AgeDepositional Evidence • Glacial till • Poorly-sorted • erratics • drumlins
Ice AgeEffects • Sea level change • Pluvial Lakes • Isostacy
Carbon DioxideIPCC Report • Atmospheric CO2 concentration has increased from pre-industrial value of about 280 ppm to 379 ppm in 2005 • Atmospheric CO2 concentration increased by only 20 ppm over 8000 years prior to industrialization • Since 1750, CO2 concentration has risen by nearly 100 ppm • Annual CO2 growth rate larger during last 10 years (1995–2005 average: 1.9 ppm yr–1) than since continuous direct measurements began (1960–2005 average: 1.4 ppm yr–1).
Classic CO2 Graph • Carbon Dioxide has steadily increased—anthropogenic cause • Probably began in industrial revolution • Superimposed are variations with seasons • More CO2 in winter, less in winter • Due to photosynthesis
Globally Go Forth and Multiply! World Population CO2 World Population vs. CO2
The concentrations and radiative forcing by (a) carbon dioxide (CO2), (b) methane (CH4), (c) nitrous oxide (N2O) and (d) the rate of change in their combined radiative forcing over the last 20,000 years reconstructed from Antarctic and Greenland ice and fi rn data (symbols) and direct atmospheric measurements (panels a,b,c, red lines). The grey bars show the reconstructed ranges of natural variability for the past 650,000 years (IPCC)
Pleistocene GlaciationCauses • Milankovich Theory • Axis wobbles • 23,000 yr cycle • Eccentricity • Shape of Earth’s orbit • 100,000 year cycle • Obliquity • Angle of Earth’s axis changes • 41,000 year cycle • Precession