Download
1 / 17
210 likes | 379 Vues
The Arecibo radio telescope. 2009 teachers workshop Phil Perillat. Talk Outline. Step from incoming signal through the telescope to the recorded data. Signals we receive A telescope with a spherical reflector. Tracking a source The front end receiver. From front end to recording device.

E N D
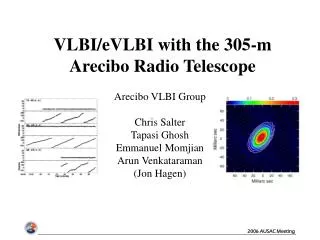
The Arecibo radio telescope 2009 teachers workshop Phil Perillat Teachers workshop 21feb09 arecibo observatory
Talk Outline • Step from incoming signal through the telescope to the recorded data. • Signals we receive • A telescope with a spherical reflector. • Tracking a source • The front end receiver. • From front end to recording device. • The backend recording devices. Teachers workshop 21feb09 arecibo observatory
The signals we receive • Optical vs AO Radio frequencies: • Optical and Radio waves are electromagnetic radiation that differ in frequency. • The different frequencies measure different physical processes. • Optical: • 6*10^14 Hz , .5 microns wavelength • Peak radiation from stars similar to our sun. • Human eye adapted to this frequency. • Radio: • 300 MHz to 10 GHz: 1meter to 3 cm (AO frequency range). • 1420 MHz line emission from a hydrogen spin flip (proton, electron spins aligned or unaligned). • We can directly measure the Electric field (and it’s phase). This is hard to do in the optical. Teachers workshop 21feb09 arecibo observatory
The optics .. A parabolic reflector • Properties of a parabolic reflector: • 1 axis of symmetry looking down from focus. • Point focus has no spatial extent so high frequencies, and large bandwidths are possible. • To track an object you must move the entire reflector. • Arecibo’s dish is too large to move. • An object moves through the A0 beam in 13 seconds (at 1400 MHz) • High sensitivity observations require longer integration times. • We need to be able to track a source for a longer time. Teachers workshop 21feb09 arecibo observatory
The optics .. A spherical dish • Properties of a spherical reflector: • Looking along any radius is an axis of symmetry. • Plane waves focus along a line. • Focus spatially extended frequency dependent. • Using a line feed, maximum frequency about 2 GHz (12cm) • Maximum bandwidth of each linefeed about 40 MHz. • To track an object, move the antenna at the line focus to follow the celestial object. • Line feed must always point back at the center of curvature. • Can track objects for up to 2hr 40 minutes (depending on how close to “overhead” the object transits) • Longer integrations allow for more sensitive measurements. • At higher zenith angle some of the beam falls off the dish. Teachers workshop 21feb09 arecibo observatory
The optics .. Gregorian reflectors • Need spherical dish for tracking objects • Want point focus to go to high frequencies and large bandwidths. • Gregorian reflectors.. secondary & tertiary. • Let rays pass through line focus • Use a secondary and tertiary shaped reflector to refocus the rays back to a point focus. • Now have high frequency and wide bandwidth capabilities (just like a parabolic dish). Teachers workshop 21feb09 arecibo observatory
The optics ..beam size • Angular units: • radian=57.3 deg, • 1 deg=60 arcMinutes, • 1 deg=3600 arcSeconds. • Beam size or spatial resolution. • Depends on how many wavelengths fit into the reflector diameter (305 Meters for AO) • Beamsize=K*wavelength/dishDiameter (K close to 1) • At 300 MHz (1 meter) beam=15 arcminutes • At 10 GHz (3 cm) beam=27 arcSeconds • Linear distance: D=radius*thetaRadians • At the moon: Radius=384403(km), ThetaRadians=27./(3600*57.3) so D=50.3 kilometer spot size with the 10 GHz Beam. Teachers workshop 21feb09 arecibo observatory
Tracking a source • Need to keep the telescope pointed at the source. • Need to position feed to about 5 asecs accuracy (3 mm at the horn) in absolute space. • Repeatable tracking errors: • Deflection in structure, incorrect curvature of rails. • Make a model of these errors by tracking a number of sources rise to set and measuring their offsets. • Create a model that adds these offsets to the requested positions when we track a normal source. Teachers workshop 21feb09 arecibo observatory
Tracking a source • Non repeatable errors. • Stretching of the main cables with temperature causes entire platform to move up and down. • Use 6 distomats around the reflector rim to measure the position of the platform. • Tiedown jacks and cables use the distomat information to pull or let up on the corners to keep the height of the platform fixed. • With the distomats and tiedowns running every two minutes we can keep the average height of the platform to with 1 mm rms over a day. Teachers workshop 21feb09 arecibo observatory
The horn transitions the e/m wave from free space to a cable. Want to minimize the reflection at this interface. Free space impedance: 376 ohms Cable impedance: 50 ohms. The polarizer will separate the two orthogonal polarizations (linear or circular). The information in the two polarizations is independent. A polarizer can span about an octave bandwidth (maxFreq/2). This limits the frequency range of the front end and requires us to have multiple receivers. List of front end receivers at AO: 327,430,1100-1800,1900-3100,3000-4000,4000-6000,6000-8000, and 8000-10000 MHz The front end receiver.. horn Teachers workshop 21feb09 arecibo observatory
The front end receiver..weak signals • Astronomical signals are weak. • Units, constants • 1 Jansky(Jy) = 1e-26 watts/m^2/Hz (a strong source) • Kb=1.38e-23 Joules/Kelvin . Boltzmans constant converts between energy and temperature. • How strong is a 1Jy source at AO? • 40e3m^2 *1Jy =2.*2.2e-22 watts/Hz • Factor of two since two independent polarizations. • Dividing by Kb and time averaging: • 2.2e-22/Kb = 14.5 Kelvins/Jy. • So a 1 Jy source will raise the noise temperature of the receiver system by 14.5 Kelvins (actually it’s more like 10 or 12 after efficiencies are included). . Teachers workshop 21feb09 arecibo observatory
The front end receiver .. cooled • A dewar is used to cool the first set of amplifiers to about 15 Kelvins. • A room temperature amplifier (temp=300K) would add thermal noise >> than the 5 Kelvins from the sky or the few kelvins from the source. • The dewar is first evacuated to reduce conduction and convection. • Helium gas is used as the cooling medium: • The gas is cooled using free expansion in a compressor mounted on top of the dome. It is then circulated through the dewar. • After 30 db (x1000) of gain in the dewar, the 25K dewar input signal temperature is now 25000K. Room temperature amps can then be used to increase the temperature without adding to the noise. Teachers workshop 21feb09 arecibo observatory
Mixing to an Intermediate freq • We have about 10 dewars that cover 300 to 10 GHz (the rf RadioFrequency) • After the dewar we translate (mix) the RF frequency to a common Intermediate Frequency (IF). • Multiply the Rf signal by a fixed reference (LO) freq.: • cos(rf)cos(lo)=1/2(cos(rf+lo) + cos(rf-lo)) • Use a filter after the mixer to remove (rf+lo) frequencies. You are left with (rf-lo). • We can then use common electronics for all the dewars. • Example. Move 4.5 to 5.5 GHz down to 1-2 GHz • IF=1.5, RF=5, LO=IF + RF=6.5 GHz. The band is flipped: • 5.5 -> 1.0 since 5.5 is 1.0 GHz from 6.5 • 5.0 -> 1.5 since 5.0 is 1.5 GHz from 6.5 • 4.5 -> 2.0 since 4.5 is 2.0 GHz from 6.5. Teachers workshop 21feb09 arecibo observatory
Processing and recording the signal • Need to sample the analog voltage, process, and then record it. • The processing done depends on the type of experiment we are doing. • Square the voltage to get the total power. • Used when looking at the continuum emission from objects. • Measure the power versus frequency. Fourier transform the input voltages, then compute the power in each frequency bin. • Used when measuring spectral lines and doppler shifts. • Integrate to increase the signal to noise: • The noise goes down as = 1/sqrt(bandwidth*integrationTime) Teachers workshop 21feb09 arecibo observatory
Spectral line emission from a galaxy • Hydrogen radio emission at 1420.4058 MHz (21 cm). • Most of the baryonic (normal) matter in the universe is hydrogen. Use the line emission to probe the universe. • 1420 emission from a galaxy. • Motion of galaxy away from us will doppler shift 1420 to a lower freq. • The larger the doppler shift the farther away the object is (expansion of the universe). 70Km/sec per megaParsec=3.26e6 light years. • The width of the line will measure the rotation of the galaxy • One side of galaxy is approaching, the other side is moving away. • The integral of all the energy under the profile measures the hydrogen mass of the galaxy.. Teachers workshop 21feb09 arecibo observatory
ugc1291 • 1420 line doppler shifted to 1403.8 MHz • df/f = vel/c object vel=3507 Km/sec • Hubbles law: 70Km/sec for each megaParsec (3.26e6 light years). • 3507/70 * 3.26E6=163 Million light years away (time it took the light to get to us) • The galaxy is about 1 MHz wide (about 210 Km/sec). The galactic rotation velocity at the edge of the hydrogen disc is about 100 Km/second. Teachers workshop 21feb09 arecibo observatory
Summary • Spherical dish so we can track • Gregorian reflectors to get back to point focus with high freq and large bandwidths • Cool the front end to improve system noise. • Mix to intermediate freq for common analog processing • Spectral analysis of spectral lines gives information on distance, rotation, and mass. Teachers workshop 21feb09 arecibo observatory