Download
1 / 40
440 likes | 828 Vues
Integrating Phenological Measurements into. Climate Monitoring. Definition of Phenology.

E N D
Integrating Phenological Measurements into Climate Monitoring
Definition of Phenology • Phenologywhich is derived from the Greek word phaino meaning to show or to appear, is the study of periodic plant and animal life cycle events that are influenced by environmental changes, especially seasonal variations in temperature and precipitation driven by weather and climate. Thus, timings of phenological events are ideal indicators of global change impacts. • Seasonality is a related term, referring to similar non-biological events, such as timing of the fall formation and spring break-up of ice on fresh water lakes.
Examples of Phenology • Sprouting, leafing, and flowering of plants in spring • Leaf color change in autumn • Bird migration and nesting • Insect hatches • Animal emergence from hibernation
History of Phenology • Ancient and traditional uses related to agriculture, due to the connection of changes in the local environment to plant development. • Specific events can serve as “indicators” to guide other activities. This can be useful for garden planting in the spring, especially for early season crops, or if some early planting risk is needed to ensure success.
New Uses of Phenology • Global Change Science—phenological observations serve as an independent measure of the effect of climate change on biological organisms. • Ecosystem linkages—phenological observations at different levels of the food chain (plant growth, insect hatching, bird feeding/nesting) can shed light on “ripple effects” of climate change.
Critical Research Areas • Atmosphere-Biosphere Interactions • Long-term Organism response to Climate Change • Global Phenology Databases for monitoring and management
Phenology is an essential component of the biosphere Climate Temperature, Precipitation, Radiation, Humidity, Wind Chemistry CO2, CH4, N2O ozone, aerosols Heat Moisture Momentum CO2 CH4 N2O VOCs Dust Minutes-To-Hours Biogeophysics Biogeochemistry Carbon Assimilation Aero- dynamics Water Decomposition Energy Mineralization Microclimate Canopy Physiology Phenology Hydrology Inter- cepted Water Days-To-Weeks Bud Break Soil Water Snow Leaf Senescence Species Composition Ecosystem Structure Nutrient Availability Water Evaporation Transpiration Snow Melt Infiltration Runoff GPP, Plant & Microbial Respiration Nutrient Availability Ecosystems Species Composition Ecosystem Structure Years-To-Centuries WatershedsSurface Water Subsurface Water Geomorphology Disturbance Fires Hurricanes Ice Storms Windthrows Vegetation Dynamics Hydrologic Cycle Bonan (2002) Ecological Climatology: Concepts and Applications. Cambridge University Press
Global Change Influences & is Influenced by Phenology Amplification of seasonal cycle Phenology modulates terrestrial carbon cycles at multiple temporal & spatial scales
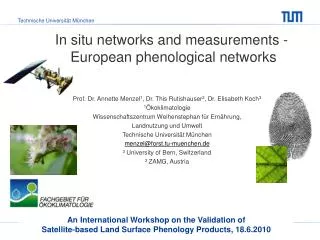
Global Phenological MonitoringIssues: Few Networks, Multiple Standards, and Little Coordination • Europe • Asia • North America • Southern Hemisphere • Role of ISB Phenology Commission
Jill Attenborough, Woodland Trust 157,000 observations from citizens In the UK in spring 2005 alone! http://www.phenology.org.uk
Elisabeth Beaubien Plantwatch National Coordinator University of Alberta, Edmonton www.naturewatch.ca
Example Phenological Applications(emphasizing advantages of co-location/coordination with climate data)
Integrated Approach(to Data Collection) • Satellite Observations (MODIS-NDVI/EVI in USA) • Indicator Species Phenology • Native Species Phenology
Cloned lilac first leaf and first bloom datesat a single station in Vermont
Spring indices based on first leaf date for lilacs Syringa vulgaris (common lilac) Syringa chinensis (cloned lilac) Schwartz and Reiter 2000 International. J. Climatology
Spring Index based on Simulated First Leaf Date: Slope from 1961-2000 Schwartz et al. 2006 Global Change Biology Spring Index based on Damage Index Value (First Leaf – Last Frost)
Diurnal Range Change with Lilac First Leaf Source: Schwartz 1996, Figure 3
Spring Phenology Campaign 2006 • Spatially: 3/7 cyclic sampling; 25m unit distance; 300m×600m Area; 216 trees
Hu, Q., Weiss, A., Feng, S., & Baenziger, P.S. (2006) Early winter wheat heading dates and warmer springs in the U.S. Great Plains. Agricultural and Forest Meteorology 135:284. 1946 Heading date: when head (spike) on 50% of the Kharkof cultivar emerges from the flag leaf.
Phenology can help in detecting/anticipating climate change effects on the synchrony between organisms Plants and pollinators Natural enemies of insect pests
Changes in Wildfire and the Timing of Spring in Western US Forests A.L. Westerling, H.G. Hidalgo, D.R. Cayan, T.W. Swetnam. Science (in press) Correlation between large (> 400 ha) forest wildfire frequency & streamflow center timing. Fire Vulnerability associated with earlier spring onset. Vulnerability = % change moisture deficit with delayed spring onset, scaled by fraction of forest area Forest wildfire frequency for early, mid and late tercile timing of spring since 1970.
Vision of a USA National Phenology Network (NPN) • a continental-scale network observing regionally appropriate native plant species, cloned indicator plants (lilac +?), and selected agricultural crops • designed to complement remote sensing observations • data collected will be freely available to the research community and general public
PREAMBLE: Phenology is a far-reaching component of environmental science but is poorly understood. Critical questions include how environmental factors affect the phenology of different organisms, and how those factors vary in importance on different spatial and temporal scales. We need to know how phenology affects the abundance and diversity of organisms, their function and interactions in the environment, especially their effects on fluxes in water, energy, and chemical elements at various scales. With sufficient observations and understanding, phenology can be used as a predictor for other processes and variables of importance at local to global scales, and could drive a variety of ecological forecast models with both scientific and practical applications. USA-NPN Implementation Team 4/16/06
The predictive potential of phenological phenomena requires a new data resource, a national network of integrated phenological observations and the tools to analyze them at multiple scales. This network is essential to evaluate ongoing environmental changes. It can now capitalize on integration with other observation networks and remote sensing products, emerging technologies and data management capabilities, myriad educational opportunities, and a new readiness of the public to participate in investigations of nature on a national scale. USA-NPN Implementation Team 4/16/06
USA-NPN Monitoring Framework AmeriFlux, AgriFlux NSF LTER, NEON USGS WEBB USDA FS Exp. F & R Intensive Sites NWS Coop NPS Inv. & Mon. USDA FIA State Ag. Exp. Sta. Spatially Extensive Science Networks Increasing Process Knowledge Data Quality # of Measurements Decreasing Spatial Coverage GLOBE Garden clubs Nat. Plant Soc. Campuses Spatially Extensive Volunteer & Education Networks NASA USGS NOAA Remote Sensing and Synoptic (wall-to-wall) Data
Colocation with NWS Cooperative Observer Program (COOP) Tier 2: Example of Spatially Extensive Science Network
Tier 3:Example Of Volunteer & Education Networks
NPN-Tier 4: REMOTE SENSING can fill gaps between ground observations to produce a continuous surface of phenology estimates at the continental scale Land surface phenology metrics, based on time-series Vegetation Index Start of season End of season Duration of season Peak season Seasonally integrated vegetation index Satellite SOS vs. GPP estimates (USDA-AgriFlux) Days offset n = 13 x = 2.23 std = 8.21 +5 -10 1999 2000 Mandan, ND
Milestones for USA-NPN 8/24-25/2005 1st NPN Planning Workshop, Tucson funded by NSF, USGS, NPS, FS, & EPA 3/22-24/2006 NPN Implementation Team meeting 6/12/2006 Presentation USGS Exec. Leadership Team 8/15/2006 USGS Bureau Planning Council approves $275K/yr for Natl. Coordinating Office 9/1/2006 Univ. of AZ offers free space + Asst. Dir. 9/8/2006 USGS approves plan to locate Natl. Office at Univ. of Arizona 10/1/2006 USGS advertises Exec. Direction position 10/9-13/2006 2nd NPN Planning Workshop, Milwaukee funded by NSF, USGS, FWS & NASA Fall/2006 NSF RCN grant $500K/5 yrs hopefully funded 1/01/2007 National Coordinating Office staffed and located in Tucson Spring 2007 First set of observations nationwide
Global Phenological Monitoring:Implementation Challenges • Development of Protocols—in good shape thanks to BBCH standardization • Species selection/coordination—careful study and implementation using a nested approach • Data sharing agreements—non-trivial issue • Site Colocation and Integration Issues—being addressed by COST 725 action in Europe, different challenges in other regions
Recommendations • Draw from NPN and EPN/COST experience as templates for starting phenology networks in other places • Consider funding a study of how to best establish phenology networks, accounting for existing environmental networks and potential for volunteer observers (best by country or continent?) • First step could be promotion of phenological observations by national weather networks