Download
1 / 86
910 likes | 1.39k Vues
Cytoscape and networks. David Amar http://tau.ac.il /~davidama/bioinfo_tutorials. Network biology. Overview: systems biology Represent molecular entities Represent interactions Two main data types Pathways Interaction networks. Biological interaction networks.

E N D
Cytoscape and networks David Amar http://tau.ac.il/~davidama/bioinfo_tutorials
Network biology • Overview: systems biology • Represent molecular entities • Represent interactions • Two main data types • Pathways • Interaction networks
Biological interaction networks • Nodes: genes or other molecules • Edges: evidence for some interaction – can contain weights, directions Magtanong et al. 2011 Nature
Biological interaction networks • Nodes: genes/proteins or other molecules • Edges based on evidence for interaction Gene co-expression Protein-protein interaction Genetic interaction Breker and Schuldiner 2009 Voineagu et al. 2011 Nature
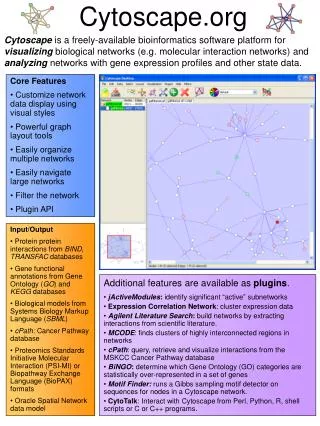
Cytoscape • Cytoscape is an open source software for integrating, visualizing, and analyzing networks. • This tutorial describes the Cytoscape 3 user interface. • Outline • Basics • Load and visualize data • Customize • Applications • Clustering • Enrichment analysis • GeneMANIA • Modmap • Gene expression analysis
Initial window Main Network View, initially blank. The toolbar, contains command buttons, the name is shown when the mouse pointer hovers over it. Control Panel: lists the available networks by name Network Overview Pane Table Panel: can be used to display node, edge, and network table data
Load data: import from databases The initial window enables searching in the big public databases
Load data: import from databases Search example: by gene name Choose databases
Import result The imported networks by name Basic statistics
Look at a network Main Network View The toolbar, contains command buttons, the name is shown when the mouse pointer hovers over it. Control Panel: lists the available networks by name Network Overview Pane: move around! Table Panel: displays node, edge, and network table data
Search for a gene Information about the marked nodes
Import result The new network
Load data: from files • We sometimes have our own data • From papers • A special search in a database • Our experiment (e.g., correlation between genes) • Famous formats • SIF • A table • OWL – for pathways, “complex” text • But easy to get and very informative once uploaded
Load from files Contains an interaction network of 331 genes from Ideker et al. 2001 Science
Load data: from SIF files Text: name1<space or tab>interaction_type<space or tab>name2
Load data: from a table • From excel files or tab-delimited text tables
Load data: from a table Set where to look for the nodes and the type
Load data: from a table OPTIONAL: Click on the columns that you want to be kept as “attributes”
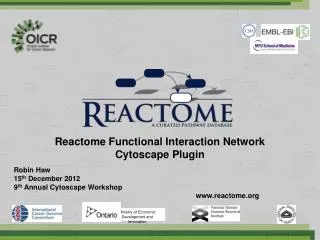
Load data: OWL • Good for looking at pathways • This example: data from the Reactome database
Load data: result Directed edges: signaling
Zoom Focus on a selected region (nodes in yellow)
Zoom: result Move around
Get a sub-network The sub-network was created below the original network
Save the session • We imported six networks • Before we start modifying them lets save the session • File -> Save Sanity check: close Cytoscape and load the session!
Remarks • At this point we know to load data from databases and files • We can perform simple navigation, zoom and save • We saved different networks each its own visualization ‘rules’ • A good habit that saves troubles: save a session for each visualization type • Multiple networks, but keep a consistent visualization
Modifying and saving a visualization • Cytoscape supports countless options • Layouts • Node size, color, label… • Edge width, line type… • We will show main examples that are enough to start • To save the graph as an image:
Circular layout • Places all of the nodes in a circular arrangement. • Very quick • Partitions the network into disconnected parts and independently lays out those parts.
Force-directed Uses physical simulation that models the nodes as physical objects and the edges as springs connecting those objects together.
Change the scale Before: scale is 1 Scale is 8
Style Open and modify
The IntActnetowrk: node color Node color Each column represents some information that we have Discrete: set a value for each type of information
Apps • Cytoscape also has many tools called ‘apps’ • Install by going to Apps -> App Manager • Applications support • Advanced analysis • Biological analysis • Integrating data • Import special data
I) Find and annotate dense areas • Use an app that “clusters” the network • Biological assumption • We look for protein communities • Many interactions within • Probably share function • Gene function prediction
Step 1: remove duplicated edges • Sometimes nodes are linked by more than one edge • Multiple evidence for interaction • Remove them for clustering and simpler visualization
Step 3: look at the results All clusters Sorted by size Select a cluster