Download
1 / 1
10 likes | 215 Vues
Visualization of peptide-protein relationship networks in Cytoscape Luis Mendoza 1 and Ruedi Aebersold 1,2 1 Institute For Systems Biology, Seattle, WA; 2 Institute for Molecular Systems Biology,ETH Zurich, Zurich, Switzerland. INTRODUCTION. DISCUSSION.

E N D
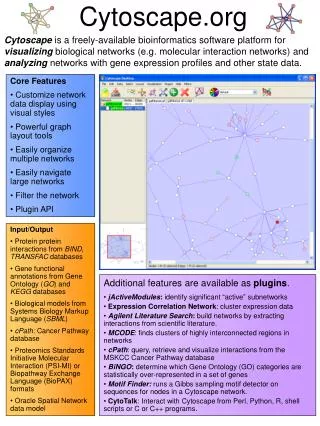
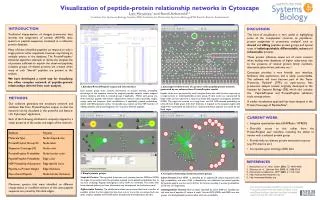
Visualization of peptide-protein relationship networks in Cytoscape Luis Mendoza1 and Ruedi Aebersold1,2 1Institute For Systems Biology, Seattle, WA; 2Institute for Molecular Systems Biology,ETH Zurich, Zurich, Switzerland INTRODUCTION DISCUSSION Traditional interpretation of shotgun proteomics data involves the assignment of tandem (MS/MS) mass spectra to peptide sequences contained in a reference protein database. Many of these identified peptides correspond to only a single protein; other sequences, however, may belong to multiple entries in the database. The ProteinProphet1 statistical algorithm attempts to derive the simplest list of proteins sufficient to explain the observed peptides; complex groups of related proteins are created when many of such "shared" peptides are present in the analysis. We have developed a novel way for visualizing the often complex network of peptide-protein relationships derived from such analysis. This kind of visualization is very useful at highlighting some of the complexities common to peptide-to-protein assignment in proteomics analysis3, such as shared and sibling peptides, protein groups, and special cases of indistinguishable, differentiable, subset and subsumable proteins. These protein inference issues are of more concern when dealing with databases of higher eukaryotes due to the presence of related protein family members, alternative splice forms, isoforms, etc.3 Cytoscape provides a very friendly user interface, facilitates data exploration, and is easily customizable. The software will soon become part of the Trans-Proteomic Pipeline4 (TPP), an open-source, free proteomics analysis toolset originally developed at the Institute for Systems Biology (ISB), which also includes the PeptideProphet and ProteinProphet validation tools, among others. A similar visualization approach has been adopted in the Protein View page of PeptideAtlas5. 2. Cytoscape-rendered view of a portion of the peptide-protein network generated by our software from ProteinProphet results Peptide nodes are represented by small triangles; those with thick borders map only to a single protein or indistinguishable protein group. Protein nodes are represented by large circles, and are colored in a range from white (0% sequence coverage) to dark blue (100%). The edges are colored in a range from red (0.0 NSP-adjusted probability) to white (0.5) to bright green (1.0); their thickness is mapped to the assigned weight, with weight=0.0 represented by dashed lines. Sequence-identical peptides are joined by thin black edges. 1. Standard ProteinProphet output and web interface Each protein group entry contains information on protein name(s), probability, percentage of the sequence covered by assigned peptides, peptide counts, assigned spectra statistics, and links to related groups, if applicable. Within each group one finds individual peptide information: independent evidence status (asterisk), weight, charge state and sequence (with modifications, if applicable), peptide probabilities (initial and NSP-adjusted), number of tolerable (e.g. tryptic) termini, NSP (number of sibling peptides), and group designators for sequence-identical peptides. METHODS Our software generates the necessary network and attribute files from ProteinProphet output, so that the network can be visualized in the powerful and feature-rich Cytoscape2 application. Each of the following attributes is uniquely mapped to a visual property of the nodes and edges of the network: Attribute Property . Molecule Type Node shape & size ProteinProphet Group ID Node label Sequence Coverage (%) Node color ProteinProphet Probability Node border color PeptideProphet Probability Edge color NSP Probability Adjustment Edge label & color Peptide-to-Protein Weight Edge thickness Non-shared Peptide Node border thickness Moreover, spectra that were identified to different charge states or modified versions of the same peptide sequence are joined by thin dark edges. CURRENT WORK • Integrate quantitation data (ASAPRatio / XPRESS) • One-click access to this utility from the ProteinProphet user interface, including the ability to render only a selected protein group • Provide links to relevant protein annotation sources (e.g. IPI, Uniprot, etc.) • Incorporate gene ontology (GO) data REFERENCES • Nesvizhskii et. al., Anal. Chem. 2003, 75, 4646-4658 • Shannon et. al., Genome Res. 2003,13, 2498-2504 • Nesvizhskii & Aebersold, MCP 2005, 4, 1419-1440 • http://tools.proteomecenter.org • http://www.peptideatlas.org 3. Simple protein groups Single-hit Proteins: The top panel shows two such proteins (entries #338 and #295); the edges are annotated with the penalties imposed to the peptide probabilities due to the lack of siblings. Peptides belonging to entry #270 are rewarded. The nodes have been selected (yellow) and their information can be inspected on the bottom panel. Differentiable Proteins: The middle panel shows two proteins that share a number of peptides (notice the thin edges), but also have one or more that are unique. Each was given a high probability by ProteinProphet (indicated by the bright green border). 4. Complex relationships between protein groups Subset Proteins: Entry #587f is identified by 21 peptides (8 unique sequences) with high probabilities, and entry #163 is identified by one additional non-shared peptide. All peptide weights are thus set to 0.0 for the former, resulting in protein probabilities of 0.0 and 1.0, respectively. Indistinguishable Proteins: Both proteins identified by entry #188 are identified by the same set of peptides (2 unique, 6 total). Entries #379, #587b, and #587e are also groups of indistinguishable proteins, albeit with zero probability. This project has been funded by a grant to the Seattle Proteome Center from the National Heart, Lung, and Blood Institute, National Institutes of Health, under contract No. N01-HV-28179.