Download
1 / 25
250 likes | 275 Vues
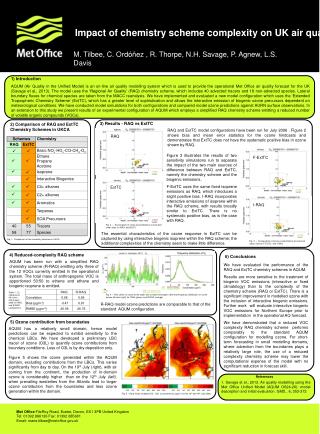
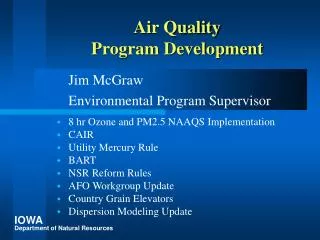
Evaluate the impact of different chemical mechanisms on air quality policy development in the context of emissions, ozone distribution, and chemical reactions. This study assesses various mechanisms such as Carbon Bond Mechanism and SAPRC-07 in air quality policy models and their responses to VOCs and NOx emissions. The research includes a comparison with observations, country source-receptor relationships, ozone productivities for isoprene, and policy implications for emission projections up to 2020, highlighting the importance of uncertainty analysis in air quality modeling.

E N D
IMPACT OF CHEMICAL MECHANISM CHOICE ON AIR QUALITY POLICY DEVELOPMENT Dick Derwent rdscientific, Newbury, UK 12th TFMM Meeting 11 – 13th May 2011, Zurich This presentation was sponsored by UK Defra ALE under contract number AQ 0704
Policy formulation CHEMICAL MECHANISMS IN AIR QUALITY POLICY MODELS Emissions O3 distribution in time and space CHEMICAL MECHANISM Meteorology Transport Dispersion Chemical reactions Rate coefficients Photolysis rates AIR QUALITY POLICY MODEL
MECHANISMS EVALUATED Carbon Bond Mechanism 4 Carbon Bond 05 SAPRC-99 SAPRC-07 Master Chemical Mechanism MCMV3.1 Common Reactive Intermediates CRIv2
CONSTRUCTION OF CHEMICAL MECHANISMS Chemical mechanisms contain rate coefficient and product yield data covering two major areas: the inorganic chemistry of the fast photochemical balance the organic chemistry of the degradation of VOCs which generates ozone Few of the thousands of reactions involved in the organic chemistry have been studied in the laboratory and many are estimated using structure-activity relationships. In contrast, all of the 45 inorganic reactions have been studied in the laboratory.
CHEMISTRY OF VOC AND NOx – OZONE FORMATION Inorganic reactions common to all mechanisms O3 hu O2 NO2 NO OH HO2 carbonyl products VOC CO RO2 RO O2 O2 reaction, decomposition or isomerisation NO NO2 Organic reactions are mechanism specific O2 O3 hu Slide provided by Michael Jenkin
EVALUATING CHEMICAL MECHANISM CHOICE:PROTOCOL AND METHODOLOGY We have adopted a specific Protocol in this study and harmonised: PUMA Campaign: Birmingham, West Midlands UK 26th June 1999 Meterology, transport and dispersion – Met Office NAME atmospheric dispersion model 96-hour 3-D back-track trajectories Emissions: EMEP SO2, NOx, VOCs, CO, NH3, isoprene for Europe NAEI for UK VOC speciation from NAEI for UK and Europe Dry deposition: Wesely dry deposition velocity approach Initial and boundary conditions All 46 inorganic chemical reaction rate coefficients All photolysis rate coefficients All input parameters set at their ‘best estimate’ values
Stoke-on Trent Wolverhampton PUMA CAMPAIGN – STUDY AREA – WEST MIDLANDSLOCATION OF O3 MONITORING STATIONS Birmingham 2 West Bromwich Birmingham Centre North Aston Hill (EMEP) Leamington Spa Arrival point 50 km London Harwell (EMEP)
CHEMICAL DEVELOPMENT ALONG AN ILLUSTRATIVE TRAJECTORY – PUMA CAMPAIGN 26th JUNE 1999
PUMA Campaign 26th June 1999 Conclude that all mechanisms achieve a satisfactory level of model performance against observations COMPARISON OF MODEL WITH OBSERVATIONS 1-σ confidence ranges on observations Upper limit of observations Lower limit of observations AURN observations are ± 5ppb or ±5% for 1-σ
Response = O3base case – O330% case MORE SENSITIVE TO VOCs THAN NOx MODEL RESPONSES TO NOx AND VOC REDUCTIONS EQUALLY RESPONSIVE Factor of 2.5 MORE SENSITIVE TO NOx THAN VOCs All mechanisms achieved a satisfactory level of performance against observations Factor of 4
All mechanisms achieved a satisfactory level of performance against observations COUNTRY SOURCE-RECEPTOR RELATIONSHIPS FOR VOCs Unexplained differences in chemistry Netherlands VOC emissions switched off Factor of 2 range in UK
All mechanisms achieved a satisfactory level of performance against observations OZONE PRODUCTIVITIES FOR ISOPRENE Unexplained differences in chemistry Factor of 1.5 difference over UK ISOPRENE PULSE ADDED
All mechanisms achieved a satisfactory level of performance against observations POLICY IMPACT OF EMISSION PROJECTIONS TO 2020 Target air quality was not achieved with MCMv3.1, CRI, SAPRC-99 and SAPRC-07 mechanisms Only CBM4 and CB05 achieved air quality target Target air quality SO2, NOx, VOC, CO and NH3 emissions from EMEP webdab
ARE THESE MODEL OZONE POLICY DIFFERENCES STATISTICALLY SIGNIFICANT? Despite all 6 chemical mechanisms giving a satisfactory comparison vs observations for the PUMA Campaign with ‘best estimate’ inputs: These mechanisms gave radically different responses to 30% reductions in VOC and NOx emissions SAPRC-99, SAPRC-07 and CBM4 were equally as responsive whereas MCMv3.1, CRI and CB05 gave stronger VOC responses When assessing emissions projections from 1999 to 2008 and on to 2020, only CBM4 and CB05 mechanisms achieved target air quality
UNCERTAINTY ANALYSIS Most AQ policy models using ‘best estimate’ inputs give single-point information for each point in time and space Although the model input data are known to be uncertain, we have no way of knowing how this uncertainty is reflected in AQ model results for policy applications. How does the uncertainty in the input data propagate through the AQ model? Is it amplified or is it damped in the policy applications?
Thousands of uncertain parameters Many thousand of uncertain parameter combinations UNCERTAINTY ANALYSIS IN THE UK PTM VOC emissions NOx emissions SO2 emissions CO emissions methane emissions isoprene emissions VOC speciations deposition velocities initial concentrations boundary conditions x,y,z trajectory positions air parcel temperatures air parcel pressures air parcel humidities boundary layer depths all rate coefficients and photolysis rates Are all these parameter combinations are valid?
MONTE CARLO UNCERTAINTY ANALYSIS assign subjective uncertainty ranges for each input parameter sample 1000 independent multiple air mass trajectories for that hour from NAME dispersion model arriving at Birmingham during PUMA campaign on 26th June 1999 between 15:00 and 15:15z random choice of chemical mechanism perform 50,000 UK PTM runs to sample all the uncertain parameters randomly and simultaneously select only those parameter choices that predict correctly the O3 observations in the West Midlands region
MONTE CARLO ANALYSIS OF ALL PTM MODEL UNCERTAINTIES all dry deposition velocities: x 0 – 1 longitude and latitude of position: ± 0.45o x 1-3; ± 0.28o NH3 VOC NOx SO2 CO CH4 emissions: x ± factor of 2 VOC speciation: x ± factor of 2 isoprene emissions: x ± factor of 4 initial conditions: x ± factor of 1.5 boundary layer depth: x ± factor of 2 relative humidity: x ± factor of 2 temperature: ± 0 – 3 oC choice of NAME trajectory: select 1 out of 1000 independent choices random choice of mechanism with all rate coefficients: ± 30 % These are all subjective estimates of the uncertainties of input parameters relative to their ‘best estimate’ values.
Fixed PUMA campaign input for 26th June 1999 MONTE CARLO ANALYSIS TO FIND ACCEPTABLE PARAMETER SETS Monte Carlo sampled input PTM model Generate 50,000 sets of outputs Fail Pass Check against O3 observations Reject parameter sets Store parameter sets 11694 acceptable parameter sets
PTM model PROBABILISTIC UNCERTAINTY ANALYSIS IN A POLICY CONTEXT Monte Carlo analysis A single model run is replaced by 11694 runs PTM model with 11694 acceptable sets of parameters -30 % NOx control case -30 % VOC control case Base case
PROBABILISTIC ASSESSMENT OF VOC vs NOx SENSITIVITIES Deterioration Improvement Probability distributions are similar for all mechanisms Differences from 1999 base case Unexplained features of the chemistry
Deterioration Improvement PROBABILISTIC ASSESSMENT OF VOC vs NOx SENSITIVITIES Equal probability of air quality deterioration or improvement Probability distributions are similar for all mechanisms Differences from 1999 base case
Air Quality Target ACHIEVING AIR QUALITY TARGETS UNDER UNCERTAINTY 4% probability of meeting 60 ppb air quality target 2020 emission projections from EMEP webdab
CHOICE OF CHEMICAL MECHANISM –POLICY CONCLUSIONS UNDER UNCERTAINTY Replace categoric conclusions from single-point model output with probability distributions from 50,000 Monte Carlo sampled runs Whereas 30% VOC control always gives air quality improvement, 30% NOx control appears to give improvement and deterioration with equal probability, independent of chemical mechanism choice The probability that a 60 ppb air quality target will be reached by 2020 on current emission projections is small, 4%, and independent of chemical mechanism choice Policy conclusions from single-point air quality model runs may not be robust to chemical mechanism choice