Download
1 / 16
170 likes | 365 Vues
Impact of Policy Interventions on Urban Air Quality in India: A Retrospective Analysis. Presented at BAQ 2004 Agra, 6 th -8 th December 2004. Early 1990 ’ s, SPM-Comparison Across Cities (Source: UNESCAP 2000). Annual Avg. (ug/m3). Background & Context.

E N D
Impact of Policy Interventions on Urban Air Quality in India: A Retrospective Analysis Presented at BAQ 2004 Agra, 6th-8th December 2004 Sameer Akbar, The World Bank
Early 1990’s, SPM-Comparison Across Cities(Source: UNESCAP 2000) Annual Avg. (ug/m3) Sameer Akbar, The World Bank
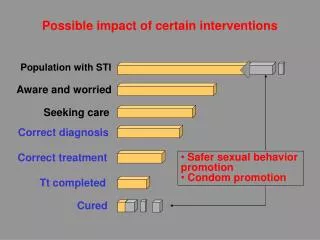
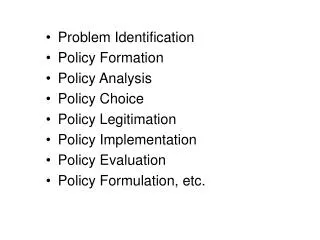
Background & Context • Very high levels of urban air pollution, especially particulate pollution, in Indian cities in the 1990’s. • Independent analyses estimated that it could be responsible for significant health damage. • A series of policy interventions followed, in which civil society and judiciary have played a major role (Delhi has set an example) • A number of other highly polluted cities to prepare “action plans” for addressing urban air pollution. • On-going debate among air quality experts about the exact impacts of specific measures that have already been taken, and by how much the urban air quality has improved as a result. Sameer Akbar, The World Bank
Objectives • To undertake a retrospective analysis of urban air quality interventions and trends (with a focus on particulate pollution) for five major metros over ten years (1993 to 2002); and • To strengthen, within the limits of the available data and analytical methods, the understanding of factors influencing ambient air quality in different cities so as to assist in the process of formulating future city-level strategies and action plans for addressing urban air pollution. Sameer Akbar, The World Bank
Cities Selected (PM Averages, 2002) NEERI Data Sameer Akbar, The World Bank
Example: Chronology of Key Actions in Kolkata • 1995: Industry • Air polluting industries directed to install air pollution control devices • 1996: Transport • Fuel Quality: 0.5% S diesel mandated • 1997: Industry • Siting policy for red category (hazardous) industry was implemented • 1998: Transport • Low smoke 2T oil for two-stroke engine vehicles mandated • 0.25% S diesel mandated in Kolkata Metropolitan Area • 1999: Transport • Pre-mixed 2T oil for two-wheelers mandated • 2000: Transport • Diesel sulphur reduced to 0.25% for all of Kolkata • 2001: Transport & Industry • Low sulphur petrol and diesel (0.05%) mandated • The use of cleaner fuels made mandatory in industrial boilers Sameer Akbar, The World Bank
Air Quality Data • RSPM data collected by NEERI between 1993-2002 was used; taken from reports submitted to CPCB. • Also used CPCB / SPCB data for RSPM since it became available in 1999 / 2000, for comparison purposes. • Data Quality Issues: • Limited number of measurements (usually less than 104 / yr in the early years) • Instrument calibration frequency varies between agencies and locations • No systematic cross-calibration or comparison of samplers used by different agencies • Handling of filter papers varies between agencies • Location of monitoring stations and days of monitoring differ between agencies • Equipment were replaced by NEERI in the made- to late-1990’s Sameer Akbar, The World Bank
Annual Average RSPM Concentration Sameer Akbar, The World Bank
1328 industries closed or relocated in 1996-97 Lower S in diesel and other industrial fuel Change in monitoring equipment ! National Standard (Residential) Sameer Akbar, The World Bank
Example: Trend Analysis for PM in Delhi • Observation : • The annual ambient RSPM averages on a city-wide scale did not show a discernible impact of the penetration of CNG as an automotive fuel in 2000-02! • Possible explanations: • The lower emissions from the previously diesel-fueled and two-stroke gasoline engine vehicles were offset by higher emissions from increasing overall vehicle use in Delhi, particularly of diesel vehicles, and ambient RSPM concentrations would have worsened in the absence of the CNG conversion programs. • Given multiple sources of air pollution in Delhi, the impact was not large enough to be reflected in the ambient RSPM concentrations, while a likely larger impact on PM2.5 levels could not be detected because PM2.5 is not currently being monitored. • Meteorological data could have influenced the readings. However, a closer look at the meteorological parameters suggest that there were no significant changes in key parameters as compared to preceding years. • The quality of RSPM data collected is very poor ! Sameer Akbar, The World Bank
Monthly Variation in RSPM Sameer Akbar, The World Bank
Relative Contribution of Sources to PM2.5 in 2001 Source: ESMAP 2004 Sameer Akbar, The World Bank
Changes in RSPM levels & Health Benefits Sameer Akbar, The World Bank
Concluding Remarks • RSPM, the main pollutant of public health concern, fell between 1993 and 2002. Clearly, the interventions undertaken had some effect ! • This decline in RSPM levels might have led to nearly 13,000 fewer cases of premature deaths in the five cities by 2002, than in the early 1990s. • Despite substantial past progress the levels of RSPM are dangerously above the national standards in Delhi and Kolkata, especially in winter. • Given that there is no established threshold for health impacts all cities will gain substantial health benefits from further reductions in RSPM. • Reductions in RSPM concentrations have been achieved through a combination of measures targeting industry, transport, and better urban planning / development. • Implementation of the same interventions in two cities with different meteorology and/or mix of sources is unlikely to give the same results. • The importance of strengthening data collection, management, and dissemination cannot be over-emphasized. The power of analysis undertaken in this study is constrained by the quality of data. Sameer Akbar, The World Bank
Sector-wise summary of key actions across the cities Sameer Akbar, The World Bank
Thank You !The team comprised of the following: • CPCB • B. Sengupta • S. A. Dutta • R. C Trivedi • N. Badhwar • World Bank • Masami Kojima • Kseniya Lvovsky • K Mukundan • U Balasubramanian • Faisal Siddiqui • Khaliquzzaman • Sameer Akbar The full report entitled: For a Breath of Fresh Air: Ten Years of Progress and Challenges in Urban Air Quality Management in India 1993-2002 , can be accessed at http://www.worldbank.org/sarurbanair Sameer Akbar, The World Bank