Download
1 / 25
250 likes | 270 Vues
Explore the permeability and porosity distribution in a Niagaran Reef Trend field using visualization aids and modeling techniques. Analyze core samples by rock type to understand key trends and optimize well completions for improved reservoir performance.

E N D
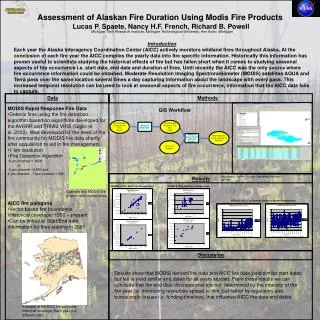
Permeability and Porosity Imaging of a Niagaran Reef Permeability [md] 30 A. S. Wylie, Jr. and J. R. Wood Michigan Technological University 0
Niagaran Reef TrendField Location Belle River Mills Gill (1977)
Niagaran Reef – Generalized Facies Salina Evaporite and Carbonate Units Enclose Reefs Time Surface ? Debatable STROMATOLITE MAP (next) BOUNDSTONE REEF CONGLOMERATE WACKESTONE 500 ft VE 2X 500 ft after Gill (1977)
XSEC N 10 11 Maximum height 400 ft above Non-reef Brown Niagaran Deviated well Belle River Mills Structure MapTop Reef -1900 14 -1600 Cored Well (34 total) 0.5 mile CI: 50 ft Reef Well Reef Rubble Well
Niagaran StratigraphyBelle River Mills –Rock Types MAP (previous) Rock Type Color Codes Gill (1977)
Core – Porosity & Permeability (all samples in Reef by Rock Type) Avg-11 md (761) [13, 100-7000] Avg-10.7% (761) 0 35 0 100 Avg-260 md (2259) [416, 100-7000] Avg-10.7% (2259) 0 35 0 100 Avg-79 md (1824) [231, 100-7000] Avg-9.4% (1824) 0 35 0 100 Avg-48 md (177) [22, 100-7000] Gill (1977) Avg-9.9 (177) Number of samples (###) 0 35 0 100
Core Phi vs. Perm – By Rock Type STROMATOLITE n=1824 WACKESTONE n=761 Permeability (md) CONGLOMERATE BOUND STONE n=177 Porosity (%) n=2259
Visualization Orientation – 2D and 3D example views Vertical Exaggeration (VE) – 1X to 10X
Visualization Animation Example – Permeability 25 – 30+ millidarcies Stromatolite Wackestone non-reef Niagaran cored interval Boundstone Conglomerate VE 10X
Reef Permeability Cumulative Percent – all samples 30 md (70%) > 30 md RESET to 30 md Percent Core Permeability (millidarcies) 4980 samples
Reef Permeability – By Rock Type 30 md (70%) > 30 md RESET to 30 md Percent Core Permeability (millidarcies) 4980 samples
Permeability Distributionred voxels are 27 – 30+ millidarcies VE 10X Many other methods for modeling permeability
Log Curve Amplitude Slicing- Review WEST EAST • Any regularly sampled data from boreholes SLICES Top Reef (e.g. Log or Core curve data) • One or more correlative, bounding time-surfaces 250 ft Base Reef, Time-surface (?) 0.5
Niagaran Core – One Permeability Slice 31 Wells Slicing Bottom Up 0 100md Belle River Mills Reef Limit 23672 (log scale) 23672 PERM CURVE Zero Perm Boundary SLICE 175 N Contour Interval 4 millidarcies 1 mile Well/Core Control Point
Niagaran Core Permeability Animation 31 Wells Slicing Bottom Up 0 100md Belle River Mills Reef Limit 23672 (log scale) N Contour Interval 4 millidarcies 1 mile Well/Core Control Point
Reef Porosity – By Rock TypeCumulative Percent Percent Core Porosity (%) 4980 samples
Niagaran Core – One Porosity Slice 31 Wells Slicing Bottom Up PHI 0 20% Belle River Mills Reef Limit 23672 23672 PHI CURVE SLICE 175 Zero Phi Boundary Contour Interval 4% porosity N 1 mile Well/Core Control Point
Niagaran Core Porosity Animation 31 Wells Slicing Bottom Up PHI 0 20% Belle River Mills Reef Limit 23672 Contour Interval 4% porosity N 1 mile Well/Core Control Point
Key Trends – Core Perm, Core Phi & GR Core Permeability Core Porosity Gamma Ray Slice 324 UppermostBOUNDSTONE more control wells Slice 145 WACKESTONE
What can we do with these models ?
2D and 3D Visualization aids interpretation of Permeability and Porosity Trends in the Reef ( 25+ md ) VE 10X Better targeting analysis for vertical and horizontal wells
Perforated Intervals versus Permeability 20 - 30+ md VE 10X Perforated interval (original) Improved completions, secondary, and tertiary projects
BEST POROSITY BEST PERMEABILITY ( 25+ md ) ( > 13% ) Best Storage versus Best Deliverability Perforated interval VE10X
BEST POROSITY BEST PERMEABILITY ( 25+ md ) ( > 13% ) Storage and Deliverability vs. Rock Type Rock Types VE10X
Results/Conclusions • Location of best porosity (storage capacity) and best permeability (deliverability) does not always coincide in the reservoir (reef) • Existing well data used to model reservoir porosity and permeability distribution • Methodology uses affordable software