Download
1 / 1
10 likes | 235 Vues
Chronostratigraphy in Chemical Sediments and Ashfalls J. Wood – Michigan Technological University. Environmental Clues in Ancient Rocks.

E N D
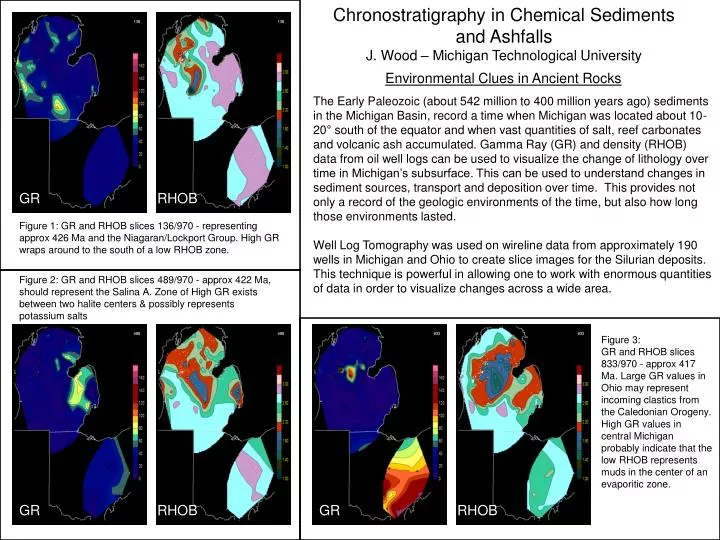
Chronostratigraphy in Chemical Sediments and Ashfalls J. Wood – Michigan Technological University Environmental Clues in Ancient Rocks The Early Paleozoic (about 542 million to 400 million years ago) sediments in the Michigan Basin, record a time when Michigan was located about 10-20° south of the equator and when vast quantities of salt, reef carbonates and volcanic ash accumulated. Gamma Ray (GR) and density (RHOB) data from oil well logs can be used to visualize the change of lithology over time in Michigan’s subsurface. This can be used to understand changes in sediment sources, transport and deposition over time. This provides not only a record of the geologic environments of the time, but also how long those environments lasted. Well Log Tomography was used on wireline data from approximately 190 wells in Michigan and Ohio to create slice images for the Silurian deposits. This technique is powerful in allowing one to work with enormous quantities of data in order to visualize changes across a wide area. GR RHOB Figure 1: GR and RHOB slices 136/970 - representing approx 426 Ma and the Niagaran/Lockport Group. High GR wraps around to the south of a low RHOB zone. Figure 2: GR and RHOB slices 489/970 - approx 422 Ma, should represent the Salina A. Zone of High GR exists between two halite centers & possibly represents potassium salts Figure 3: GR and RHOB slices 833/970 - approx 417 Ma. Large GR values in Ohio may represent incoming clastics from the Caledonian Orogeny. High GR values in central Michigan probably indicate that the low RHOB represents muds in the center of an evaporitic zone. GR RHOB GR RHOB