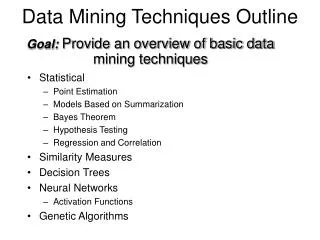
Data Mining Concepts & Techniques for Data Preprocessing
Understand general data characteristics, explore, clean, integrate, and reduce data. Learn about different types of attribute values and how to preprocess data effectively.

Data Mining Concepts & Techniques for Data Preprocessing
E N D
Presentation Transcript
Data Mining: Concepts and Techniques— Chapter 2 — TUGAS 1 dikiumpulkan tanggal 10 April 2010 ( PRogramming ) 2orang 1 kelompok Data Mining: Concepts and Techniques
Chapter 2: Data Preprocessing • Karakteristik data secara umum • Diskripsi data dan eksplorasi • Mengukur kesamaan data • Data cleaning • Integrasi data dan transformasi • Reduksi data • Kesimpulan Data Mining: Concepts and Techniques
Types of Attribute Values • Nominal • E.g., profession, ID numbers, eye color, zip codes • Ordinal • E.g., rankings (e.g., army, professions), grades, height in {tall, medium, short} • Binary • E.g., medical test (positive vs. negative) • Interval • E.g., calendar dates, body temperatures • Ratio • E.g., temperature in Kelvin, length, time, counts Data Mining: Concepts and Techniques
Discrete vs. Continuous Attributes • Discrete Attribute • Has only a finite or countably infinite set of values • E.g., zip codes, profession, or the set of words in a collection of documents • Sometimes, represented as integer variables • Note: Binary attributes are a special case of discrete attributes • Continuous Attribute • Has real numbers as attribute values • Examples: temperature, height, or weight • Practically, real values can only be measured and represented using a finite number of digits • Continuous attributes are typically represented as floating-point variables Data Mining: Concepts and Techniques
Chapter 2: Data Preprocessing • General data characteristics • Basic data description and exploration • Measuring data similarity • Data cleaning • Data integration and transformation • Data reduction • Summary Data Mining: Concepts and Techniques
Mining Data DescriptiveCharacteristics • Motivasi • Untuk memahami data: sebaran, kecenderungan terpusat, dan variasi • Karakteristik dari sebaran data • median, max, min, quartiles, outliers, variance • Dimensi numerik terkait dengan interval yang terurut • Boxplot atau quantile analysis pada interval yang terurut Data Mining: Concepts and Techniques
Mengukur kecenderungan terpusat ( Central Tendency) • Rata-rata (sample vs. population): • Weighted arithmetic mean: • Trimmed mean: chopping extreme values • Median: A holistic measure • Middle value if odd number of values, or average of the middle two values otherwise • Estimated by interpolation (for grouped data): • Mode • Value that occurs most frequently in the data • Unimodal, bimodal, trimodal • Empirical formula: Data Mining: Concepts and Techniques
Symmetric vs. Skewed Data • Median, mean and mode of symmetric, positively and negatively skewed data symmetric positively skewed negatively skewed Data Mining: Concepts and Techniques
Contoh : Upah Karyawan PT. Satria Semarang F = 82 Me = 82 : 2= 41 Kelas : 260 - 279
Rumus Median: Tepi Kelas Bawah Tepi Kelas Atas atau
Measuring the Dispersion of Data • Quartiles, outliers and boxplots • Quartiles: Q1 (25th percentile), Q3 (75th percentile) • Inter-quartile range: IQR = Q3 –Q1 • Five number summary: min, Q1, M,Q3, max • Boxplot: ends of the box are the quartiles, median is marked, whiskers, and plot outlier individually • Outlier: usually, a value higher/lower than 1.5 x IQR • Variance and standard deviation (sample:s, population: σ) • Variance: (algebraic, scalable computation) • Standard deviation s (or σ) is the square root of variance s2 (orσ2) Data Mining: Concepts and Techniques
Properties of Normal Distribution Curve • The normal (distribution) curve • From μ–σ to μ+σ: contains about 68% of the measurements (μ: mean, σ: standard deviation) • From μ–2σ to μ+2σ: contains about 95% of it • From μ–3σ to μ+3σ: contains about 99.7% of it Data Mining: Concepts and Techniques
Graphic Displays of Basic Statistical Descriptions • Boxplot: graphic display of five-number summary • Histogram: x-axis are values, y-axis repres. frequencies • Scatter plot: each pair of values is a pair of coordinates and plotted as points in the plane • Loess (local regression) curve: add a smooth curve to a scatter plot to provide better perception of the pattern of dependence Data Mining: Concepts and Techniques
Histogram Analysis • Graph displays of basic statistical class descriptions • Frequency histograms • A univariate graphical method • Consists of a set of rectangles that reflect the counts or frequencies of the classes present in the given data Data Mining: Concepts and Techniques
Histograms Often Tells More than Boxplots • The two histograms shown in the left may have the same boxplot representation • The same values for: min, Q1, median, Q3, max • But they have rather different data distributions Data Mining: Concepts and Techniques
Scatter plot • Provides a first look at bivariate data to see clusters of points, outliers, etc • Each pair of values is treated as a pair of coordinates and plotted as points in the plane Data Mining: Concepts and Techniques
Loess Curve • Adds a smooth curve to a scatter plot in order to provide better perception of the pattern of dependence • Loess curve is fitted by setting two parameters: a smoothing parameter, and the degree of the polynomials that are fitted by the regression Data Mining: Concepts and Techniques
Positively and Negatively Correlated Data • The left half fragment is positively correlated • The right half is negative correlated Data Mining: Concepts and Techniques
Not Correlated Data Data Mining: Concepts and Techniques
Scatterplot Matrices Matrix of scatterplots (x-y-diagrams) of the k-dim. data [total of C(k, 2) = (k2̶ k)/2 scatterplots] Used by permission of M. Ward, Worcester PolytechnicInstitute Data Mining: Concepts and Techniques
Chapter 2: Data Preprocessing • General data characteristics • Basic data description and exploration • Measuring data similarity(Sec. 7.2) • Data cleaning • Data integration and transformation • Data reduction • Summary Data Mining: Concepts and Techniques
Similarity and Dissimilarity • Similarity • Numerical measure of how alike two data objects are • Value is higher when objects are more alike • Often falls in the range [0,1] • Dissimilarity (i.e., distance) • Numerical measure of how different are two data objects • Lower when objects are more alike • Minimum dissimilarity is often 0 • Upper limit varies • Proximity refers to a similarity or dissimilarity Data Mining: Concepts and Techniques
Data Matrix and Dissimilarity Matrix • Data matrix • n data points with p dimensions • Two modes • Dissimilarity matrix • n data points, but registers only the distance • A triangular matrix • Single mode Data Mining: Concepts and Techniques
Example: Data Matrix and Distance Matrix Data Matrix Distance Matrix (i.e., Dissimilarity Matrix) for Euclidean Distance Data Mining: Concepts and Techniques
Minkowski Distance • Minkowski distance: A popular distance measure where i = (xi1, xi2, …, xip) and j = (xj1, xj2, …, xjp) are two p-dimensional data objects, and q is the order • Properties • d(i, j) > 0 if i ≠ j, and d(i, i) = 0 (Positive definiteness) • d(i, j) = d(j, i)(Symmetry) • d(i, j) d(i, k) + d(k, j)(Triangle Inequality) • A distance that satisfies these properties is a metric Data Mining: Concepts and Techniques
Special Cases of Minkowski Distance • q = 1: Manhattan (city block, L1 norm) distance • E.g., the Hamming distance: the number of bits that are different between two binary vectors • q= 2: (L2 norm) Euclidean distance • q. “supremum” (Lmax norm, Lnorm) distance. • This is the maximum difference between any component of the vectors • Do not confuse q with n, i.e., all these distances are defined for all numbers of dimensions. • Also, one can use weighted distance, parametric Pearson product moment correlation, or other dissimilarity measures Data Mining: Concepts and Techniques
Example: Minkowski Distance Distance Matrix Data Mining: Concepts and Techniques
Interval-valued variables • Standardize data • Calculate the mean absolute deviation: where • Calculate the standardized measurement (z-score) • Using mean absolute deviation is more robust than using standard deviation • Then calculate the Enclidean distance of other Minkowski distance Data Mining: Concepts and Techniques
Object j Object i Binary Variables • A contingency table for binary data • Distance measure for symmetric binary variables: • Distance measure for asymmetric binary variables: • Jaccard coefficient (similarity measure for asymmetric binary variables): • Note: Jaccard coefficient is the same as “coherence”: Data Mining: Concepts and Techniques
Dissimilarity between Binary Variables • Example • gender is a symmetric attribute • the remaining attributes are asymmetric binary • let the values Y and P be set to 1, and the value N be set to 0 Data Mining: Concepts and Techniques
Nominal Variables • A generalization of the binary variable in that it can take more than 2 states, e.g., red, yellow, blue, green • Method 1: Simple matching • m: # of matches, p: total # of variables • Method 2: Use a large number of binary variables • creating a new binary variable for each of the M nominal states Data Mining: Concepts and Techniques
Ordinal Variables • An ordinal variable can be discrete or continuous • Order is important, e.g., rank • Can be treated like interval-scaled • replace xif by their rank • map the range of each variable onto [0, 1] by replacing i-th object in the f-th variable by • compute the dissimilarity using methods for interval-scaled variables Data Mining: Concepts and Techniques
Ratio-Scaled Variables • Ratio-scaled variable: a positive measurement on a nonlinear scale, approximately at exponential scale, such as AeBt or Ae-Bt • Methods: • treat them like interval-scaled variables—not a good choice! (why?—the scale can be distorted) • apply logarithmic transformation yif = log(xif) • treat them as continuous ordinal data treat their rank as interval-scaled Data Mining: Concepts and Techniques
Variables of Mixed Types • A database may contain all the six types of variables • symmetric binary, asymmetric binary, nominal, ordinal, interval and ratio • One may use a weighted formula to combine their effects • f is binary or nominal: dij(f) = 0 if xif = xjf , or dij(f) = 1 otherwise • f is interval-based: use the normalized distance • f is ordinal or ratio-scaled • Compute ranks rif and • Treat zif as interval-scaled Data Mining: Concepts and Techniques
Vector Objects: Cosine Similarity • Vector objects: keywords in documents, gene features in micro-arrays, … • Applications: information retrieval, biologic taxonomy, ... • Cosine measure: If d1 and d2 are two vectors, then cos(d1, d2) = (d1d2) /||d1|| ||d2|| , where indicates vector dot product, ||d||: the length of vector d • Example: d1= 3 2 0 5 0 0 0 2 0 0 d2 = 1 0 0 0 0 0 0 1 0 2 d1d2 = 3*1+2*0+0*0+5*0+0*0+0*0+0*0+2*1+0*0+0*2 = 5 ||d1||= (3*3+2*2+0*0+5*5+0*0+0*0+0*0+2*2+0*0+0*0)0.5=(42)0.5 = 6.481 ||d2|| = (1*1+0*0+0*0+0*0+0*0+0*0+0*0+1*1+0*0+2*2)0.5=(6) 0.5 = 2.245 cos( d1, d2 ) = .3150 Data Mining: Concepts and Techniques
Chapter 2: Data Preprocessing • General data characteristics • Basic data description and exploration • Measuring data similarity • Data cleaning • Data integration and transformation • Data reduction • Summary Data Mining: Concepts and Techniques
Tugas Pokok dalam Pemrosesan awal data • Data cleaning • Mengisi nilai yang hilang, memperhalus data noise, mengidentifikasi atau menghilangkan outlier dan memecahkan ketidak konsistenanan • Integrasi data • Mengintegrasikan berbagai database, data cube atau file-file • Transformasi data Data transformation • Normalisasi dan aggregation • Reduksi data • Mendapatkan representasi dalam volume data yung sudah terkurangi tetapi menghasilkan hasil analitis yang sama atau serupa • Diskritisasi data : bagian dari reduksi data, bagian penting untuk data numerik Data Mining: Concepts and Techniques
Data Cleaning • Data yang tidak berkualitas , hasil data mining yang tidak berkualitas! • Keputusan yang berkualitas harus didasarkan pada data yang berkualitas • e.g., data ganda atau data yang hilang mungkin menyebabkan ketidakbenaran atau bahkan menyesatkan • Ekstaksi data, pembersihan, dan transformasi data merupakan tugas utama dalam data warehouse • Tugas-tugas data cleaning • Mengisi nilai-nilai yang hilang • Mengidentifikasi outliers dan memperhalus data noise • Memperbaiki ketidakkonsitenan data • Memecahkan redudansi yang disebabkan oleh integrasi data Data Mining: Concepts and Techniques
Data in the Real World Is Dirty • incomplete: lacking attribute values, lacking certain attributes of interest, or containing only aggregate data • e.g., children=“ ” (missing data) • noisy: containing noise, errors, or outliers • e.g., Salary=“−10” (an error) • inconsistent: containing discrepancies in codes or names, e.g., • Age=“42” Birthday=“03/07/1997” • Was rating “1,2,3”, now rating “A, B, C” • discrepancy between duplicate records Data Mining: Concepts and Techniques
Why Is Data Dirty? • Data yang tidak lengkap mungkin diperoleh dari • Different considerations between the time when the data was collected and when it is analyzed. • Human/hardware/software problems • Noisy data (incorrect values) may come from • Faulty data collection instruments • Human or computer error at data entry • Errors in data transmission • Inconsistent data may come from • Different data sources • Duplicate records also need data cleaning Data Mining: Concepts and Techniques
Missing Data • Data is not always available • E.g., many tuples have no recorded value for several attributes, such as customer income in sales data • Missing data may be due to • equipment malfunction • inconsistent with other recorded data and thus deleted • data not entered due to misunderstanding • certain data may not be considered important at the time of entry • not register history or changes of the data • Missing data may need to be inferred Data Mining: Concepts and Techniques
Bagaimana mengatasi Missing Value ( data yang hilang ) • Mengabaikan record-record: biasanya dilakukan bila label class hilang (tidak efektif bila % dari nilai yang hilang per atribut sangat diperhatikan • Mengisi nilai yang hilang secara manual • Mengisi secara otomatis dengan • Global konstant : e.g., “unknown”, a new class?! • Rata-rata dari atribut • Rata-rata atribut untuk seluruh sample dengan kelas yang sama : smarter • nilai yang lebih memungkinkan: yaitu dengan menggunakan metode Bayesian Data Mining: Concepts and Techniques
Noisy Data • Noise: random error or variance in a measured variable • Incorrect attribute values may due to • faulty data collection instruments • data entry problems • data transmission problems • technology limitation • Other data problems which requires data cleaning • duplicate records • incomplete data • inconsistent data Data Mining: Concepts and Techniques
How to Handle Noisy Data? • Binning • first sort data and partition into (equal-frequency) bins • then one can smooth by bin means, smooth by bin median, smooth by bin boundaries, etc. • Regression • smooth by fitting the data into regression functions • Clustering • detect and remove outliers • Combined computer and human inspection • detect suspicious values and check by human (e.g., deal with possible outliers) Data Mining: Concepts and Techniques
Simple Discretization Methods: Binning • Equal-width (distance) partitioning • Divides the range into N intervals of equal size: uniform grid • if A and B are the lowest and highest values of the attribute, the width of intervals will be: W = (B –A)/N. • The most straightforward, but outliers may dominate presentation • Skewed data is not handled well • Equal-depth (frequency) partitioning • Divides the range into N intervals, each containing approximately same number of samples • Good data scaling • Managing categorical attributes can be tricky Data Mining: Concepts and Techniques
Binning Methods for Data Smoothing • Sorted data for price (in dollars): 4, 8, 9, 15, 21, 21, 24, 25, 26, 28, 29, 34 * Partition into equal-frequency (equi-depth) bins: - Bin 1: 4, 8, 9, 15 - Bin 2: 21, 21, 24, 25 - Bin 3: 26, 28, 29, 34 * Smoothing by bin means: - Bin 1: 9, 9, 9, 9 - Bin 2: 23, 23, 23, 23 - Bin 3: 29, 29, 29, 29 * Smoothing by bin boundaries: - Bin 1: 4, 4, 4, 15 - Bin 2: 21, 21, 25, 25 - Bin 3: 26, 26, 26, 34 Data Mining: Concepts and Techniques
Regression y Y1 y = x + 1 Y1’ x X1 Data Mining: Concepts and Techniques
Cluster Analysis Data Mining: Concepts and Techniques