Download
1 / 22
220 likes | 250 Vues
Learn about excess pricing approaches, power curves, and practical considerations in casualty excess pricing. Explore the rationale, assumptions, and general formulae behind the alpha parameter. Gain insights from Swiss Re publications and other useful references.

E N D
Matβlas Underwriting and Actuarial Consulting, Training and Research Casualty Excess Pricing Using Power Curves Ana Mata, PhD, ACAS CARe Seminar London, 15 September 2009
Agenda • Excess pricing approaches • US vs. non-US • Property vs. casualty • Power curves • Rationale and assumptions • The alpha parameter • General formulae • Practical issues and considerations
Useful references • Swiss Re publications on Pareto Rating • Miccolis, Robert S. On the Theory of Increased Limits and Excess of Loss Pricing. Proceedings of the Casualty Actuarial Society 1977: LXIV 27-59 • Paul Riebesell. Einführung in die Sachversicherungsmathematik, Berlin 1936. • Thomas Mack and Michael Fackler. Exposure Rating in Liability Reinsurance, ASTIN 2003.
Excess pricing:US vs. Non-US Classes USA Classes • ISO curves for property and casualty classes • Salzmann (1963) and Hartford (1991) curves for property • Internally developed (“fitted”) loss models • Brokers’ curves and models • NCCI ELPPF for Workers Comp Non-USA Classes • Swiss Re first loss scales or exposure curves - property • Power curves – casualty • Internally developed loss models • Minimum ROL • Underwriters’ judgement
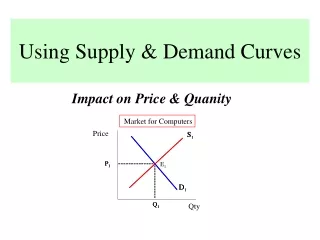
Excess pricing • Insurance and reinsurance – same rationale • Commonly used approaches • Loss distribution – ideal • Exposure curves • First loss scales • Increase limits factors • Excess factors • Rates per million of coverage • Consider • Expense handling and risk loads • Currency and inflation adjustments
Exposure curves • Assumptions: • Sum insured proxy for maximum possible loss • No incentive to under-insured • Direct relation between size of loss and amount at risk • Loss cost distribution by % of IV independent of sum insured • Curves by peril or hazard • Fire • Wind • Hurricanes
Exposure curves as a loss elimination ratio Limited expected value and loss elimination ratio 75% of losses are at 5% or less of Insured Value or Sum Insured
Other considerations • Consider all policy sections: • Building value • Contents • Other structures (e.g. attached garage) • Loss of use • Thus, loss can be > 100% of sum insured • Consider type of construction • Curves are inflation independent • Loss increases in same proportion of sum insured
Exposure curves vs. ILFs • Common (simplifying) assumption in property • Ratio is constant for risks within group • Assumptions does not hold in liability • Total limit purchased chosen by p/h • Limit ≠ maximum loss exposure • Dependence between limit and severity? • Dependence between limit purchased and exposure base (turnover, payroll, fee income, etc)?
Challenges when deriving ILFs • Claim severity vs. limit purchased • Claim severity vs. exposure base • Assumption of independence between frequency and severity • Aggregate vs. any one claim limits • IBNER and claims reserving practices • Lack of policy information at claim level • Changes of mix of business year on year • Multiple claim records for same underlying claim
The power curves • Commonly used in London Market • Non-US liability classes • EL, GL, D&O, PI, FI, etc • Insurance and reinsurance excess pricing • Other names: • Alpha curves • Riebesell’s curves • The German method • Introduced by Riebesell in 1936
The rationale behind power curves • Basic limit = B, pure premium P(B) • Pure premium for limit 2B = P(B)*(1+r), e.g. r=20% • Pure premium for limit 4B = P(B)*(1+r)(1+r) • Riebesell’s rule:
The rationale behind power curves • For any limit L, we can generalise where ld() is the binary log and 0 < z < 1 • ld(1+z) is usually called the alpha parameter
The rationale behind power curves • The loss elimination ratio is: • The ILF formula
“Nice” properties • LER only depends on ratio of x to SI • Properties of exposure curves apply • Scale invariant • Inflation • Currency • Easy closed form formula • Pareto tail
What is the distribution underlying the power curves? • Mack and Fackler 2003: For any parameters of Riebesell’s rule we can construct a claims size distribution underlying such rule. • The claim size distribution is a one parameter Pareto over a threshold u and parameter < 1. • Below the threshold u? • the distribution is constant (independent of x) • The threshold u could be a problem if deductibles or reinsurance attachment are low
Practical uses • Underwriters are primary users of these curves • Difficult to find an “alpha” that works ground up • Different alphas depending on original policy’s excess or deductible • Common to ignore deductibles and attachments from exposure rating formula
Practical issues • Exposure rating with co-insurance – stacking of limits • Discontinuities • Currency independent – OK • Inflation independent – realistic? • Experience vs. exposure rating results may show significant differences • ALAE or cost assumptions • Curves rarely adjusted for this
Power curves with stacking of limits $25MM capacity spread over various layers
Power curves with stacking of limits • Exposure rate $5MM P/O $10MM xs $10MM in the 1st RI excess: $5MM xs $5MM • Assume r = 30%, alpha = 0.3785 • $2MM are retained, $3MM are ceded • Ground up basis: • RI loss cost is 50% of $6MM xs $14MM P/O $10MM xs £10MM • Ignoring original excess • RI loss cost is 50% of $6MM xs $4MM P/O $10MM
ALAE treatment and exposure rating Apply following adjustments:
Power curves:final remarks Advantages Disadvantages Difficult to replace Validity of assumptions Odd results: High limits and excess on excess Share of limits and stacking of policies Low original deductibles Inflation independent ALAE/costs assumptions • Underwriters are “comfortable” • Aligned with UW mindset • Common alphas across the market • Scale invariant (ok for currency) • Closed form formula (no interpolation) • Pareto tail (?)