Download
1 / 26
270 likes | 406 Vues
Food and Forestry: Global change and global challenges. GCTE Keynote Address LINKS BETWEEN SCIENCE AND POLICY MAKING by Jeffrey B. Tschirley and David Norse. Requirements for policy relevant science:. Definition of the chain (filiere) of linkages.

E N D
Food and Forestry: Global change and global challenges GCTE Keynote Address LINKS BETWEEN SCIENCE AND POLICY MAKING by Jeffrey B. Tschirley and David Norse
Requirements for policy relevant science: Definition of the chain (filiere) of linkages Matrix analysis to target key policy areas and opportunities Early and direct links (collaborative partnerships) with policy research, analysis and formulation specialists
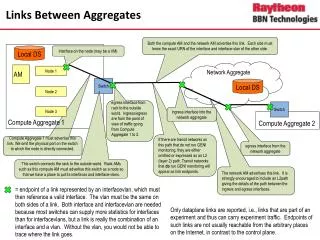
ANTHROPOGENIC DRIVERS ECOSYSTEM CHANGES Land Use/ Land Cover Change Atmospheric Composition Change Climate Change Ecosystem Structure Ecosystem Function RESOURCE & PRODUCT AVAILABILITY Genes, Species, Habitats Wood & Fibre Food Water Air Trans Boundary Air Pollution Loss of Biodiversity Resource Supply Constraints Land Degradation & Desertification Pollution & Competition in Shared Waterbasins Costal Zone Pollution GLOBAL CHANGE & SUSTAINABILITY ISSUES GTOS planning group expert 1996 GTOS Conceptual framework
Global policy formulation INFORMATION National policy planning Research and modelling Scientific researchers Operational decision makers Data volume decreases Subjectivity increases DATA Data and information pyramid
*S.E.AFRICA N.AMERICA *C.E.EUR S.ASIA REGIONAL NETWORKS COASTAL * ECOLOGY BIODIVERSITY THEMATIC NETWORK * GLACIERS * PERMAFROST * HYDROLOGY * ESTABISHED OR IN PROGRESS GT.Net - A global system of terrestrial observation network • Global demonstration projects • Net primary productivity • Terrestrial carbon initiative • Biodiversity richness study • Soil decomposition / biodiversity
The global observation hierarchy 1. Large-area experiments 2. Long-term research centres 3. Field stations 4. Periodic, unstaffed sample sites 5. Frequent low resolution remote sensing
Widening the arguments for research and policy links: • Where science fits in a policy context • Components of policy analysis implementation • Principles for policy relevant science • Closer alignment with the policy formulation processes
Science in a policy context Addressing questions such as: - In what timeframe and spatial scale will global changes occur? Short or long-term? - Will it be global or regional in terms of physical and socio-economic impacts? - What are the levels of uncertainty regarding the time scale or geographic impact?
Factors inhibiting the use of science in policy formulation: • Those primarily responsible for causing global change may not suffer most from its impacts • Misconceptions about the nature of natural resource management (NRM) problems. • Tendency to accept public information about environmental risks at face value.
Components of policy analysis and implementation: • problem identification; • strategy formulation; • selection of policy options; • policy implementation; • setting of regulatory standards; • monitoring and evaluation.
Problem identification: problems that are global in scale problems that are global in scope (and in the future may be global in scale)
Strategy formulation Summary of green-house gas emissions and characteristics. (1) ppmv and emission in Gt; (2) ppbv and emission in Mt; (3) ppbv and emission in Kt; (4) pptv; (5) weighted average of the CFCs, excluding the ones that have been phased out; (6) Global warming potential, i.e. the warming potential relative to CO2 over a 100 year period
Principles for Policy Relevant Science • Correct identification and definition of the issues • Specification of the form and timeframe in which the information is needed • Involvement of several Ministries or policy bodies • No single organization can command the data, information, expertise or finance for path-finding global research
Strategic geographical participation of scientists and institutions • Full disciplinary and analytical integration; • Transparency of data, method, and presentation; documentation of meta data; • An open peer review process and clarification of issues on which there is not yet broad consensus; • Sensitivity analysis of the scientific uncertainties and their spatial and temporal impacts; • Clear synthesis and presentation of the scientific issues and response options.
More elements for success: • break traditional molds • build new collaborative, cross-disciplinary partnerships
Scale Biodiversity-Measure Cause Continent/Globe Species Richness, life form Climate ave., extremes Landscape / Region Gamma diversity, Community dominants Terrain, soils, disturbance Species (presence/absence) Biological factors (e.g., herbivory), nutrients Community / Landscape Alpha diversity, beta diversity, richness, evenness Biodiversity Relationships with Scale
Species Abundance “The various aspects of abundance (there are a plethora of terms and indices) are often correlated with one another, but they are not interchangeable, making it difficult to compare information gathered in different ways or to select appropriate conservation priorities. A method for translating abundance information between different measures is badly needed.” (Kunin 1998)
Scaling NPP, ecosystem metabolism and biodiversity relationships From plots to: communities to: landscapes to: lifeforms to: regions/continents Relating biodiversity measures to these hierarchial levels and the different controls that occur at each scale.
Value relationships with scale Scale Biodiversity/NPP Values/Services Continent/Globe Climate moderation, CO2 reduction, trace gas reduction Increased precipitation, reduced temp. extremes, water quality/quantity improvement, erosion control, flood reduction Landscape / Region Production of fiber, grains, meat, aesthetics, pollination, soil fertility, reduced soil loss, improved quality of life, and many more! Community / Landscape
PRESSURE RESPONSE STATE Resource assessment Impact analysis Technical intervention • Re-vegetation, conservation biology • Mixed cropping, integrated plant nutrition • De-stocking, rotation systems • Land use change • High input cropping • Livestock operations • Watershed degradation, biodiversity loss • Depletion of micro organisms • Groundwater contamination, air pollution SUSTAINABILITY ANALYSIS COMPONENTS • ADJUSTMENTS TO PRESSURES: • Incentives (e.g. payments, taxes) • Training • Technology development • Participatory mechanism • Regulatory action • Codes of conduct • Valuation • Opportunity costs • Financial risk • Direct / In-direct costs ECONOMIC • Income distribution • Land reform • Access to capital • Food quality • Management capacity • TRADEOFFS: • Sensitivity analysis • Multicriteria analysis • Risk assessment SOCIAL • Natural resource endowments • Agro-ecological resilience • Production system diversity • Population supporting capacity ENVIRONMENTAL Framework for sustainability analysis
Mode of communication among researches Relevance to social Questions Types of studies Characteristics of the data Stage Logistics Few datasets, idiosyncratic format, individually designed Little communication communication within single disciplines Personal and individual YOUNG Descriptive “Esoteric” obscure Technological tools, textbooks More easily fundable, compelling MATURING Limited use of database technology Electronic communication with personal contact required Formal communications Process-oriented INDIVIDUAL AND DISCIPLINE PRODUCTIVITY Courses Graduate programs Linked, harmonized, emulative knowledge base with semantic connectivity to many datasets Multiple communication modes, discussion about scientific questions MATURE Predictive Central Jointly funded programs Adapted from Nalini. In Press. Progression of development for scientific fields