Download
1 / 105
1.06k likes | 1.54k Vues
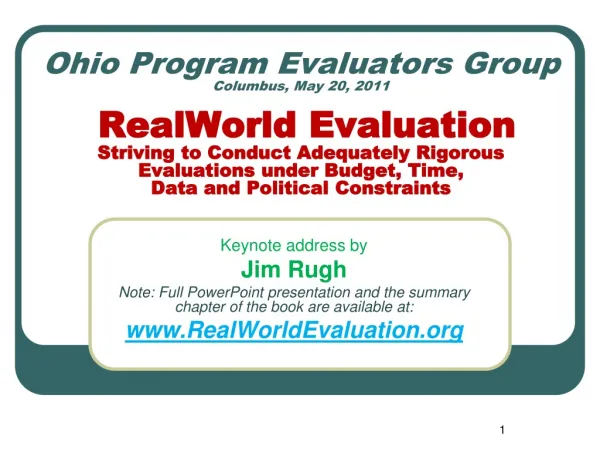
Ohio Program Evaluators Group Columbus, May 20, 2011 RealWorld Evaluation Striving to Conduct Adequately Rigorous Evaluations under Budget, Time, Data and Political Constraints. Keynote address by Jim Rugh

E N D
Ohio Program Evaluators GroupColumbus, May 20, 2011 RealWorld EvaluationStriving to Conduct Adequately Rigorous Evaluations under Budget, Time, Data and Political Constraints Keynote address by Jim Rugh Note: Full PowerPoint presentation and the summary chapter of the book are available at: www.RealWorldEvaluation.org
Main Points I want to Address 1. An introduction to the seven steps of the RealWorld Evaluation approach for addressing common issues and constraints faced by evaluators. 2. How to identify various design options that could be used in a particular evaluation setting. 3. Ways to reconstruct baseline data when the evaluation does not begin until the project is well advanced or completed.
Main Points I want to Address 4. How to answer the question ―What would have happened without the project? I.e., alternatives to statistical (RCT) counterfactuals. 5. How to identify and to address threats to the validity or adequacy of quantitative, qualitative and mixed methods.
RealWorld EvaluationDesigning Evaluations under Budget, Time, Data and Political Constraints OVERVIEW OF THE RWE APPROACH
RealWorld Evaluation Scenarios Scenario 1: Evaluator(s) not brought in until near end of project For political, technical or budget reasons: • There was no life-of-project evaluation plan • There was no baseline survey • Project implementers did not collect adequate data on project participants at the beginning nor during the life of the project • It is difficult to collect data on comparable ‘control’ groups
RealWorld Evaluation Scenarios Scenario 2: The evaluation team is called in early in the life of the project But for budget, political or methodological reasons: • The ‘baseline’ was a needs assessment, not comparable to eventual evaluation • It was not possible to collect baseline data on a comparison group
Reality Check – Real-World Challenges to Evaluation • All too often, project designers do not think evaluatively – evaluation not designed until the end • There was no baseline – at least not one with data comparable to evaluation • There was/can be no control/comparison group. • Limited time and resources for evaluation • Clients have prior expectations for what they want evaluation findings to say • Many stakeholders do not understand evaluation; distrust the process; or even see it as a threat (dislike of being judged)
RealWorld Evaluation Quality Control Goals • Achieve maximum possible evaluation rigor within the limitations of a given context • Identify and control for methodological weaknesses in the evaluation design • Negotiate with clients trade-offs between desired rigor and available resources • Presentation of findings must acknowledge methodological weaknesses and how they affect generalization to broader populations
The Need for the RealWorld Evaluation Approach • As a result of these kinds of constraints, many of the basic principles of rigorous impact evaluation design (comparable pre-test -- post test design, comparison group or other form or counterfactual, adequate instrument development and testing, random sample selection, control for researcher bias, thorough documentation of the evaluation methodology etc.) are often sacrificed.
The RealWorld Evaluation Approach An integrated approach to ensure acceptable standards of methodological rigor while operating under real-world budget, time, data and political constraints.
The RealWorld Evaluation approach • Developed to help evaluation practitioners and clients • managers, funding agencies and external consultants • Still a work in progress (we continue to learn more through feedback from colleagues) • Originally designed for developing countries, but equally applicable in industrialized nations
Expectations for « rigorous » evaluations Despite these challenges, there is a growing demand for methodologically sound evaluations which assess the impacts, sustainability and replicability of projects and programs. (We’ll be talking more about that later.)
Most RealWorld Evaluation tools are not new— but promote a holistic, integrated approach • Most of the RealWorld Evaluation data collection and analysis tools will be familiar to experienced evaluators. • What we emphasize is an integrated approach which combines a wide range of tools adapted to produce the best quality evaluation under RealWorld constraints.
What is Special About the RealWorld Evaluation Approach? • There is a series of steps, each with checklists for identifying constraints and determining how to address them • These steps are summarized on the following slide …
The Steps of the RealWorld Evaluation Approach Step 1: Planning and scoping the evaluation Step 2: Addressing budget constraints Step 3: Addressing time constraints Step 4: Addressing data constraints Step 5: Addressing political constraints Step 6:Assessing and addressing the strengths and weaknesses of the evaluation design Step 7: Helping clients use the evaluation
RealWorld EvaluationDesigning Evaluations under Budget, Time, Data and Political Constraints Step 1 PLANNING AND SCOPING THE EVALUATION
Step 1: Planning and Scoping the Evaluation • Understanding client information needs • Defining the program theory model • Preliminary identification of constraints to be addressed by the RealWorld Evaluation
A. Understanding client information needs Typical questions clients want answered: • Is the project achieving its objectives? • Is it having desired impact? • Are all sectors of the target population benefiting? • Will the results be sustainable? • Which contextual factors determine the degree of success or failure?
A. Understanding client information needs A full understanding of client information needs can often reduce the types of information collected and the level of detail and rigor necessary. However, this understanding could also increase the amount of information required!
B. Defining the program theory model All programs are based on a set of assumptions (hypothesis) about how the project’s interventions should lead to desired outcomes. • Sometimes this is clearly spelled out in project documents. • Sometimes it is only implicit and the evaluator needs to help stakeholders articulate the hypothesis through a logic model.
B. Defining the program theory model • Defining and testing critical assumptions are essential (but often ignored) elements of program theory models. • I’d like to share with you how I visualize the construction of a program theory or logic model.
Consequences Consequences Consequences PROBLEM PRIMARYCAUSE 1 PRIMARY CAUSE 2 PRIMARY CAUSE 3 Secondary cause 2.3 Secondary cause 2.1 Secondary cause 2.2 Tertiary cause 2.2.1 Tertiary cause 2.2.2 Tertiary cause 2.2.3
Consequences Consequences Consequences DESIRED IMPACT OUTCOME 1 OUTCOME 2 OUTCOME 3 OUTPUT 2.3 OUTPUT 2.1 OUTPUT 2.2 Intervention 2.2.1 Intervention 2.2.2 Intervention 2.2.3
High infant mortality rate Children are malnourished Insufficient food Diarrheal disease Poor quality of food Need for improved health policies Contaminated water Unsanitary practices Flies and rodents Do not use facilities correctly People do not wash hands before eating
Reduction in poverty Women empowered Economic opportunities for women Women in leadership roles Young women educated Improved educational policies Curriculum improved Female enrollment rates increase Parents persuaded to send girls to school School system hires and pays teachers Schools built
To have synergy and achieve impact all of these need to address the same target population. Program Goal: Young women educated Advocacy Project Goal:Improved educational policies enacted Teacher Education Project Goal:Improve quality of curriculum Construction Project Goal:More classrooms built ASSUMPTION (that others will do this) OUR project PARTNER will do this Program goal at impact level
What does it take to measure indicators at each level? Impact :Population-based survey (baseline, endline evaluation) Outcome: Change in behavior of participants (can be surveyed annually) Output: Measured and reported by project staff (annually) Activities: On-going (monitoring of interventions) Inputs: On-going (financial accounts)
Institutional and operational context Economic context in which the project operates Political context in which the project operates Socio-economic and cultural characteristics of the affected populations One form of Program Theory (Logic) Model Outputs Outcomes Design Inputs Implementation Process Impacts Sustainability Note: The orange boxes are included in conventional Program Theory Models. The addition of the blue boxes provides the recommended more complete analysis.
Expanding the results chain for multi-donor, multi-component program Increased rural H/H income Increased political participation Improved education performance Improved health Impacts Increased production Access to off-farm employment Increased school enrolment Intermediate outcomes Increased use of health services Outputs Credit for small farmers Health services Rural roads Schools Inputs Donor Government Other donors Attribution gets very difficult! Consider plausible contributionseach makes.
So what should be included in a “rigorous impact evaluation”? • Direct cause-effect relationship between one output (or a very limited number of outputs) and an outcome that can be measured by the end of the research project? Pretty clear attribution. … OR … • Changes in higher-level indicators of sustainable improvement in the quality of life of people, e.g. the MDGs (Millennium Development Goals)? More significant but much more difficult to assess direct attribution.
So what should be included in a “rigorous impact evaluation”? OECD-DAC (2002: 24) defines impact as “the positive and negative, primary and secondary long-term effects produced by a development intervention, directly or indirectly, intended or unintended. These effects can be economic, sociocultural, institutional, environmental, technological or of other types”. Does it mention or imply direct attribution? Or point to the need for counterfactuals or Randomized Control Trials (RCTs)?
Determining appropriate (and feasible) evaluation design • Based on the main purpose for conducting an evaluation, an understanding of client information needs, required level of rigor, and what is possible given the constraints, the evaluator and client need to determine what evaluation design is required and possible under the circumstances.
Some of the considerations pertaining to evaluation design 1: When evaluation events take place (baseline, midterm, endline) 2. Review different evaluation designs (experimental, quasi-experimental, other) 3: Levels of rigor 4: Qualitative & quantitative methods 5: A life-of-project evaluation design perspective.
scale of major impact indicator An introduction to various evaluation designs Illustrating the need for quasi-experimental longitudinal time series evaluation design Project participants Comparison group baseline end of project evaluation post project evaluation 36
OK, let’s stop the action to identify each of the major types of evaluation (research) design … … one at a time, beginning with the most rigorous design. 37
First of all: the key to the traditional symbols: • X = Intervention (treatment), I.e. what the project does in a community • O = Observation event (e.g. baseline, mid-term evaluation, end-of-project evaluation) • P (top row): Project participants • C (bottom row): Comparison (control) group 38
Design #1: Longitudinal Quasi-experimental P1 X P2 X P3 P4 C1 C2 C3 C4 Project participants Comparison group baseline midterm end of project evaluation post project evaluation 39
Design #2: Quasi-experimental (pre+post, with comparison) P1 X P2 C1 C2 Project participants Comparison group baseline end of project evaluation 40
Design #2+: Typical Randomized Control Trial P1 X P2 C1 C2 Project participants Research subjects randomly assigned either to project or control group. Control group baseline end of project evaluation 41
Design #3: Truncated Longitudinal X P1 X P2 C1 C2 Project participants Comparison group midterm end of project evaluation 42
Design #4: Pre+post of project; post-only comparison P1 X P2 C Project participants Comparison group baseline end of project evaluation 43
Design #5: Post-test only of project and comparison X P C Project participants Comparison group end of project evaluation 44
Design #6: Pre+post of project; no comparison P1 X P2 Project participants baseline end of project evaluation 45
Design #7: Post-test only of project participants X P Project participants • Need to fill in missing data through other means: • What change occurred during the life of the project? • What would have happened without the project (counterfactual)? • How sustainable is that change likely to be? end of project evaluation 46
Attribution and counterfactuals How do we know if the observed changes in the project participants or communities • income, health, attitudes, school attendance. etc are due to the implementation of the project • credit, water supply, transport vouchers, school construction, etc or to other unrelated factors? • changes in the economy, demographic movements, other development programs, etc
The Counterfactual • What change would have occurred in the relevant condition of the target population if there had been no intervention by this project?
Where is the counterfactual? After families had been living in a new housing project for 3 years, a study found average household income had increased by an 50% Does this show that housing is an effective way to raise income?