Download
1 / 26
260 likes | 419 Vues
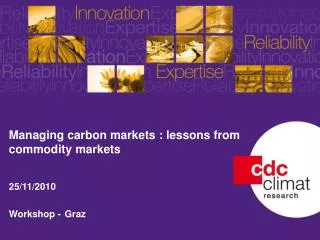
Managing carbon markets : lessons from commodity markets 25/11/2010 Workshop - Graz. 1. The link between energy and CO 2 prices. The link between energy and CO 2 prices. Price index (base 100, 2008). Source: CDC Climat Recherche, Reuters.

E N D
Managing carbon markets : lessons from commodity markets 25/11/2010 Workshop -Graz
The link between energy and CO2 prices • Price index (base 100, 2008) Source: CDC Climat Recherche, Reuters
Economic activity:Combustion sector as a decisive sector • Allocation by sectors • Allocation by country Source : CDC Climat Recherche, CITL
Economic activity:Emission to cap by EU ETS sectors • Emission to cap by sectors Source : CDC Climat Recherche, CITL
2. Carbon pricing fundamentals • Price = function of EUA supply and demand • Supply = policy decisions • Demand = actual emissions / energy demand Short run CO2 price • 1. Weather conditions • 2. Electricity price • 3. Relative energy prices • 4. Economic growth • 5. Regulatory decisions Energy demand Long run
2.1 Weather conditions: Temperature Source: CDC Climat, BlueNext Weather Index
2.1 Weather conditions: Precipitation & reservors’levels • Cold and dry weather in the Nordic region has reduced the level of dams: Norway (68%), Finland (59%) and Sweden (67,7%)
2.2 Power production and prices: Impact on Nordic electricity forward price • More than 50 % of electricity generated in the Nordic region come from Hydroelectric power stations.
2.2 Power production and prices: EU power production up… • +2,7% since beginning of 2010 • EU : 222,8 TWh, between January and August 2010… • - 3% compared to 2008 • Germany: +5,1% • France: +3,6% • Poland:+4% • Spain: +1,8 % Source: AIE, Monthly Electricity Statistics, August 2010, OECD Europe
2.2 Power production and prices: … including renewable-based power production • +110 TWh since beginning of 2010 • +14,6 % compared to 2009 • France: +41% • Poland: +41% • Italy:+23% • Portugal: +38% • UK: +3% Source: AIE, Monthly Electricity Statistics, August 2010, OECD Europe
2.3 Relative energy pricesEnergy & CO2 markets L’ambition du groupe Caisse des Dépôts (PD) Source: CDC Climat Research, Reuters
2.3 Relative energy prices: German Clean Dark & Sparks spread L’ambition du groupe Caisse des Dépôts (PD) • CO2 price change the merit order between gas and coal power station. • The relative raise in coal price and gas price has entailed a drop of the clean dark and spark spread Source: CDC Climat Research, Reuters
2.4 Economic activity:Focus on the EU ETS • Uneven and often quite low economic recovery: • Among member states • Among industrial sectors Source: CDC Climat Research, Reuters
2.4 Economic activity:Detail for EU ETS sectors Source: CDC Climat Research, Eurostat
3.1 OTC vs exchange volume • Boom in EUA trades: *5 compared to 2006 • Seasonality in T2 for compliance • Financial crisis: more trades in stock exchange than in OTC Source: CDC Climat Research, Point carbon
3.2 Spot vs Futures Source: BlueNext, NordPool, EEX, • EUA market is becoming more mature and sophisticated • Futures markets in boom compared to a drop in exchange in the spot market
4.1 A medium volatility in the commodities’ family Source: CDC Climat recherche, Reuters • Coal has a smaller volatility than others • Starting 2011, the volatility might become higher because of hedging strategies of power generators.
4.2 EUA & CER price term structure • EUA price term structure EUA price • Corridor between 14 et 17 €/t since June • Contango • CER price term structure CER price • 12 à 14 €/t since June • Backwardation
5.1 The strong importance of regulatory decisions • Cap for 2013: 2 039 MtCO2 • EU target -20 % or -30 % ? • Phase III auctions • Allocation benchmarks • Qualitative restrictions (HFC, N20) • Post-Kyoto uncertainties
5.2 EUA price forecast • Average price forecast is from24,5 €/t in 2012 and 30,3 €/t in 2020. Source: CDC Climat Research, Reuters
Thank you for your attention. nicolas.stephan@cdcclimat.com www.cdcclimat.com