Download

1 / 15
150 likes | 275 Vues
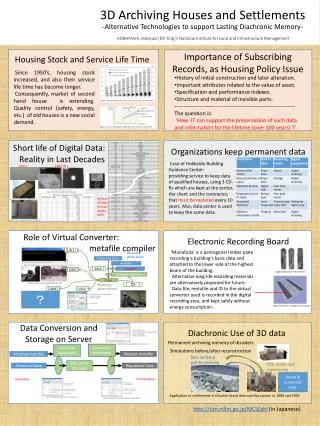
Lunchtime Discussion at IPRC. 20 February 2013. Movement of plastic debris on beaches ~indication of W EBCAM MONITARING A ND INVESTIGATION in situ~. National Institute for Land and Infrastructure Management (NILIM) Coastal, Marine and Disaster Prevention Department

E N D
Lunchtime Discussion at IPRC 20February 2013 Movement of plastic debris on beaches~indication of WEBCAM MONITARINGAND INVESTIGATION in situ~ National Institute for Land and Infrastructure Management (NILIM) Coastal, Marine and Disaster Prevention Department Coastal Zone Systems Division TomoyaKataoka Hirofumi Hinata
Plastic pollution • Risk caused by plastic debris • Threats to marine animals ex. Ingestion of plastics, Entangled sea turtles • Pollution by toxic chemicals in plastic debris ex. Lead that leach into beach (Nakashima et al., EST, 2012) • Transportation of plastic debris • Outflow from sources • Washing ashore • Returning to ocean • Washing ashore … To Pacific ocean Jean Jean Jean Outflow Outflow Outflow Wash ashore Return offshore Return offshore To Pacific ocean Wash ashore Kurochio current Outflow
Our focus Today’s First Topic • Transportation process in East Asian Seas • Monitoring quantity of debris at multiple sites Webcam monitoring (Low cost and Few labor) • Simulating drifting debris Ocean circulation model and its quantity at multiple site • Beaching process in nearshore (included returning process offshore) • Movement of debris on beach Investigation in situ Today’s SecondTopic
Webcam monitoring sites 【Today’s topic】 Tsushima Current: 4 sites Nine monitoring sites (a)Tsushima (b)Wajima (c)Tobishima) (d) Wakkanai (e) Ishigaki (f)Tanegashima Tsushima current:4 sites Tsushima current: 4 sites Kuroshio current: 4 sites Tsushima current: 4 sites Kuroshio current: 4 sites Oyashio: 1 site (i) Shiriya (g)Muroto (h)Niijima
Webcam monitoring system The webcam monitoring system Saving in a built-in Local storage (SDHC card, 32GB) Transmission via the Internet Our laboratory in NILIM Webcam Solar panels Time Control box Storage batteries Photographs Operating time every two hours from 7:00 to 15:00 (i.e., five operations every day) Taking photographs five photographs every operating time Daily number of photographs 25 photographs (i.e., 5 (operations)×5 (photos)=25)
Animation of webcam image Tobishima December 2010
Technique for detecting plastic debris pixels • 1. Generation of color references • Color references for detecting pixels of plastic debris are generated using CIELUV color space. • CIELUV color space: • This space is one of three-dimensional color spaces • Colors are expressed by (L*, u*, v*). • 2. Detection of plastic debris pixels using the color references • Plastic debris pixels are detected using color references and a composite method. L*-u* coordinate L*-v* coordinate u*-v* coordinate L* L* v* u* v* u* 1) T. Kataoka et al.(2012), MPB, 64, 1829-1836
Generation of color references Color distribution of plastic debris “C” in the CIELUV color space. , G E B C D H A F Three ellipses form the ellipsoid body Ellipsoid body in the CIELUV color space Color references Color references, which are generated from webcam images at Tobishima. aPeriods: p1, November 21-27, 2010; p2, December 14-21, 2010; p3, February 16-22, 2011; p4, April 1-7, 2011; p5, May 18-24, 2011
Detection using CRs and composite 【Detection of plastic debris using a single photograph】 Plastic debris with various colors detection e.g., Driftwoods misdetection , Plastic debris white Detection using one photograph Using one photo misdetected Using photos for three days Composite method: (L*, u*, v*) of the pixel is frequently located in the ellipsoid body of a certain color using photographs for three days. Plastic debris pixels Plastic debris Plastic debris Driftwood For 3 days Not plastic debris
Calculation of debris quantity Beached plastic debris quantity Covered area Projective transformation1) GPS (X, Y): Geographic coordinate (x, y): Photographic coordinate Coefficients 1) S.Magome et al.(2007),JO,63,761-773 Covered area A Webcam image A = N × a N: Number of plastic pixels a : Area of a single pixel Converted image 0 5 10 m Error of computed area: within5.0%
Time series of plastic debris quantity Err.: 19%, Corr.: 0.93 Err.: 12%, Corr.: 0.81 clean-up Err.: 20%, Corr.: 0.94 Err.: 21%, Corr.: 0.73 clean-up Time series of daily covered areas Short-term fluctuations depended on changes in the weather conditions (e.g., amount of sunlight, wind). Removing the short-term fluctuations Time series of 30-day moving averages (bold line).
What factor causes underestimation? Period:1month (April , 2011) Time: 7:00, 9:00, 11:00, 13:00, 15:00 Plastic Debris: Three type (Tank (Blue), Cylinder Buoy (White), Cube Buoy (White)) Calculate average value and standard deviation of (L, u, v) Cylinder Top Cube Top Tank Top Calculate average value and standard deviation of (L, u, v) Cylinder Side Cube Side Tank Side
Monthly variability of debris color (Side) Blue (Tank) White(Cylinder) White (Cube) E W Morning E W Noon E W Afternoon
Comparison with wind data Factors for variability of debris quantity Webcam sites Wind obs. sites Wind Wakkanai 2010/10/9 Wind Qin: Quantity of debris washed ashore Qout: Quantity of debris returned offshore Wind Tobishima 2010/11/5 Wave Wind Near shore current Qin> Qout Increase Qin < Qout decrease Qin= Qout not change Wajima 2010/12/5 Wind Tsushima 2010/11/22
Summary • 【Major conclusion for webcam monitoring】 • Sequential monitoring of quantity of debris at multiple sites Succeeded • Debris quantity not only vary by intensification of westerly wind but also by other factors • At Wajima and Tsushima increase according to intensification westerly wind for Nov. 2010 – Mar. 2011 • At Wakkanai and Tobishima Not vary despite intensification of westerly wind • At Tsushima Increase greatly despite no westerly wind • Factor of the underestimation Strong dependence on sunlight angle • Using only photographs on certain time when variability of debris color is the lowest Measurement error can be minimized • 【Major conclusion for Investigation in situ】 • Found seasonal variation of movement and quantity of debris • Established residual function of debris • Estimated residence time on Wadahama beach • 152 days (Three type buoys) • 98 days (PET bottle) • Obtained system characteristics on Wadahama beach