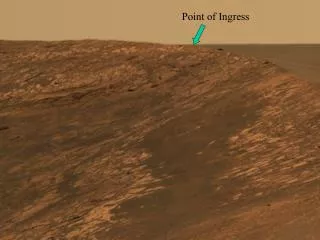
Epsilon Aurigae Eclipse 2009 - Ingress
450 likes | 596 Vues
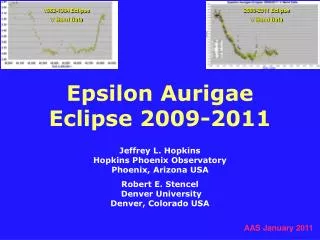
Epsilon Aurigae Eclipse 2009 - Ingress. Jeffrey L. Hopkins Hopkins Phoenix Observatory Phoenix, Arizona USA Robert E. Stencel University of Denver Denver, Colorado USA Robin Leadbeater Three Hills Observatory Cumbria, England et al.

Epsilon Aurigae Eclipse 2009 - Ingress
E N D
Presentation Transcript
Epsilon Aurigae Eclipse 2009 - Ingress Jeffrey L. HopkinsHopkins Phoenix ObservatoryPhoenix, Arizona USA Robert E. StencelUniversity of DenverDenver, Colorado USA Robin LeadbeaterThree Hills ObservatoryCumbria, England et al. Jeffrey L. HopkinsHopkins Phoenix ObservatoryPhoenix, Arizona USA Lothar SchanneVölklingen, Deutschland Germany Robert E. StencelUniversity of DenverDenver, Colorado USA SAS 2010
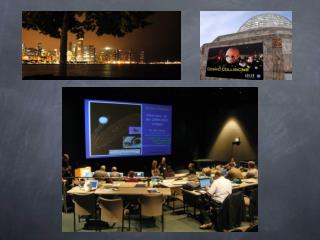
Introduction During the 1982-1984 eclipse of epsilon Aurigae an Eclipse Campaign was formed and published 13 hard copy periodic Newsletters that were sent around the world. This was before the Internet, no web sites, no e-mail. While the current eclipse started in August of last year (2009), to get a head start a new Campaign was started in May of 2006. A web site was created. This site now has a vast amount of data as well as 17 published pdf Newsletters available free. In November of 2009 we started a Yahoo list to act as a forum for near instant communication to all interested in the Campaign. We have 57 official Campaign members from 17 countries with 24 members and co-authors from 10 different countries submitting high quality photometric and spectroscopic data.
Coauthor Countries (10) India Italy Scotland Sweden USA England France Germany Greece Iceland
Co-Authors/Observers (24) Dr. Mukund Kurtadikar, Jalna Education Society Observatory Maharashtra, India Hans-Goran Lindberg, Kaerrbo Observatory Skultuna, Sweden Des Loughney Edinburgh, Scotland, United Kingdom Benji Mauclaire Observatoire du Val de I'Arc Bouches du Rhone, France Brian E. McCandless Grand View Observatory Elkton, Maryland USA Frank J. Melillo Holtsville, New York ,USA Richard Miles, Golden Hill Observatory Dorset, England Robert T. (Tom) Pearson Virginia Beach, Virginia, USA Gerard Samolyk Greenfield, Wisconsin, USA Lothar Schanne Völklingen, Deutschland, Germany Iakovos Marios Strikis Elizabeth Observatory of Athens Haldrf (Athens), Greece François Teyssier Yogurt Pot Observatory Rouen, France Olivier Thizy, Shelyak Instruments Revel, France Jeffrey L. Hopkins Hopkins Phoenix Observatory Phoenix, Arizona, USA Robert E. Stencel, University of Denver Denver, Colorado, USA Robin Leadbeater Three Hills Observatory Cumbria, England Paul J. Beckmann Jim Beckmann Observatory Mendota Heights, Minnesota, USA Christian Buil Castanet-Tolosan, France Donald Collins Warren Wilson College Ashville, North Carolina, USA Tiziano Colombo S. Giovanni Gatano al Observatory Pisa, Italy Thierry Garrel Observatoire de Foncaude Juvignac, France Stanley Gorodenski Blue Hills Observatory Dewey, Arizona USA Snaevarr Gudmundsson Lindarberg Observatory Hafnarfjordur, Iceland Thomas Karlsson Varberg Observatory Varberg, Sweden
Campaign Countries (18) Italy Netherlands North Cyprus Portugal Scotland South Korea Sweden Turkey USA Belgium Canada England Finland France Germany Greece Iceland India
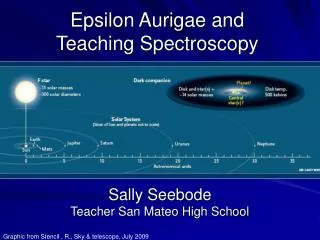
Equipment Photometry Spectroscopy Single Channel PMT Based UBV Photon Counting SSP-3 BVRI SSP-4 JH Low Resolution Star Analyser/DSLR Lhires III Spectrograph CCD Digital Single Lens Reflex Camera (DSLR - V) No telescope or tracking CCD BVRI High Resolution SBIG SGS Spectrograph Lhires III Spectrograph eShel Spectrograph
Determining Contact Points To determine the first and second contact points a Linear Regression is calculated using select ingress data and the average out of eclipse magnitude and average totality magnitude from the 1982-1984 eclipse sans the mid-eclipse brightening. For determining the slope, the start and end dates for the ingress data were selected well after first contact and well before second contact.
Linear Regression Linear Regression is used to determine the ingress slope b. Knowing Y1 the average out-of-eclipse magnitude, one can then solve for the first contact X1 (JD) and similarly for second contact X2 (JD) when Y2 is the average totality magnitude.
Determining Excluded Data To find out-of-eclipse phenomena variation data during ingress it was noted that the (U-B) value seems to be at a minimum when the variation is at a maximum. Finding the (U-B) data can then locate the data to exclude.
Out-Of-Eclipse Variations OOE Like Variations During Ingress
Ingress Slope V Band Ingress Linear Regression Data Ranges
Photometry AnalysisAverage Magnitudes Out-of-Eclipse Data from the Hopkins Phoenix Observatory December 2003 through April 2009 Average Totality Magnitudes During 1982-1984 Eclipse
Photometry AnalysisTimes (HPO Data) First Contact Times for the 1982-1984 Eclipse Ingress Data (HPO Data)
Photometry AnalysisTimes (Composite Data) First Contact Times for the 1982-1984 Eclipse Ingress Data (Composite Data)
Photometry AnalysisTimes (Summary) Average Periods, Contact and Ingress Times
Star System First Contact Predicted and Observed First Contact Dates using Linear Regression
Star System Second Contact Predicted and Observed Second Contact Dates using Linear Regression
Star System Estimating Mid-Eclipse Brightening 2010 Mid-Eclipse Brightening Prediction Dates
Star System Estimating 3rd & 4th Contact Eclipse 3rd and 4th Contact Points Prediction Dates
Interferometry Data Kloppenborg, Stencel, et al. 2010 Nature 464. 870. Interferometry was used to determine a translational velocity by measuring an angular shift over a month during ingress.
Star System Calculating Orbital Size Orbital Velocities versus Star System Size Note: These are first order approximations and the calculations assume circular orbits and constant velocity, neither of which is true.
Star System CalculatingF Star Size Translational Velocity versus F Star Size
SpectroscopyObservers (12) Spectroscopic coverage of epsilon Aurigae obtained by amateur observers during ingress.
SpectroscopyHydrogen Alpha Line Pre-eclipse After 1st Contact Before 2nd Contact After 2nd Contact Hydrogen Alpha Line Evolution During Ingress
SpectroscopyHydrogen Gamma Line Spectra in the Hydrogen gamma region (4341 Å) taken during ingress divided by the mean pre eclipse spectrum to reveal narrow shell lines from the eclipsing object.
SpectroscopySodium D Lines Pre-eclipse After 1st Contact After 2nd Contact Sodium D Line Evolution During Ingress
SpectroscopyPotassium K I 7699 Å Line 1st Contact 2nd Contact Potassium K I 7699 Å Line Evolution During Ingress
SpectroscopyIntensity and Radial Velocity Note broadening the engulfs the red wing Increased intensity in absorption line Wiggles in line show variations in velocity e.g., this feature shows a shift to the red , i.e., an increase in radial velocity Emission regions show up red Absorption core is very deep black False color image showing variations in intensity and radial velocity with time in lines adjacent to Hydrogen a
Spectroscopic Analysis Time dependence of the excess equivalent width of the K I 7699 Å profile
Conclusions The system's mid-eclipse maximum is predicted to be the end of July 2010, with third contact predicted for March 2011 and fourth contact for May 2011. During the late spring and summer observing season the star system can be seen from higher latitudes early evening and just before sunrise. While the system is observable, the air mass through which the observations must be made is very high. Some of the most interesting and important data could be obtained during these times so it is worthwhile to put the extra effort into the observing. High air mass photometry requires careful correction of extinction. Ideally, nightly extinction coefficients should be determined. The Campaign is archiving photometric and spectroscopic data. The photometric data are now archived as a text file and MS Word file. They are available for download from the Campaign web site. The archive covers UBVRI photometric data from before the 1982 eclipse to 06 May 2010. The Campaign web site will also continue to host the spectroscopic data. A paper including the Campaign's archived photometric data is planned for the IBVS.
Acknowledgements We would like to thank all the worldwide observers who have been and are contributing data to this Eclipse Campaign. We also wish to thank Brian Kloppenborg for his helpful comments during the development of this paper.