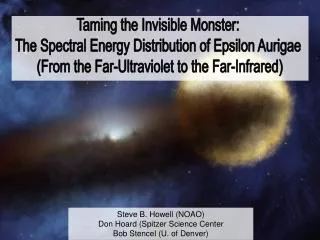
Spectroscopic Imaging of Epsilon Aurigae: A Detailed Analysis of Lunar Eclipse Observations
140 likes | 271 Vues
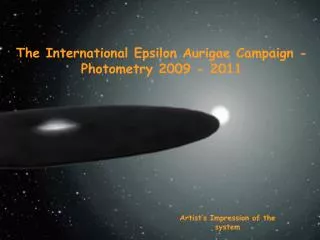
This project documents the imaging and spectroscopic analysis of Epsilon Aurigae conducted at the College of San Mateo's Science Center and Planetarium during a lunar eclipse on October 27, 2007. Utilizing a Losmandy G-11 mount with an 8” SCT, we achieved high-quality images and spectra through careful calibration and processing. The analysis includes dual star imaging and flux calibration against standard stars, with a focus on obtaining precise measurements of spectral lines, particularly the hydrogen alpha line. This comprehensive study contributes to our understanding of Epsilon Aurigae's characteristics.

Spectroscopic Imaging of Epsilon Aurigae: A Detailed Analysis of Lunar Eclipse Observations
E N D
Presentation Transcript
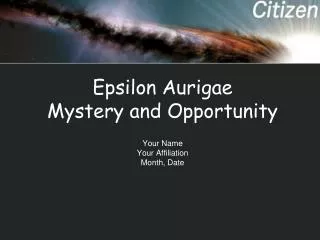
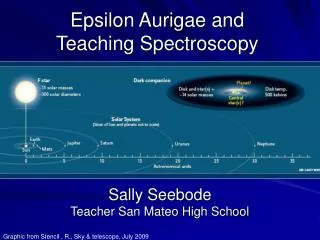
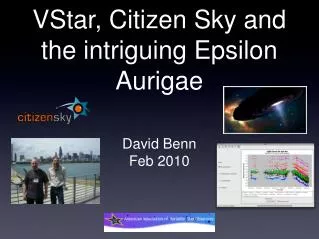
Epsilon Aurigae
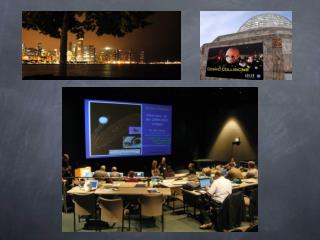
College of San Mateo Science Center & Planetarium Lunar eclipse 10-27-07
Imaging: Deep sky Planetary Photometry Spectroscopy Video
Equipment: Losmandy G-11-excellent tracking. 8”SCT @f/6.3-good signal-5 min. exp. ST7-XME CCD-SGS matched, guide chip.SBIG-SGS -1.06 A/pix x765. -Oriented E/W
Software: TheSky 6-accurate mount control CCDSoft-image acquisition Maxim DL-image reduction (darks) Iris, Vspec, IRAF-spectra processing
Calibration spectra: Blue=mercury 4358, px. 236 Red=neon 6402, px. 332(SGS micrometer) Exp.=Merc=180s Neon=90s(autodarks)
Imaging: 2 Stars: eps Aur & HR1544 ConnectST7 SyncSky6 Focusmanual Calibrateguider Testexposure
Imaging: 1st calibration spectra:red or blue. Image 1st star: eps Aur or 1544, 5 min. Slew/image 2nd star: same wavelength. 2nd cal. spectra:re-image both stars. All images: x2 Dark frames: x10
Processing: IRAF Starting point for analysis: Raw eps Aur / red. Intensity level vs. pixel number.
Processing: IRAF Raw HR1544 / red. Standard star, used to flux calibrate eps Aur. -Taken the same night.
Processing: IRAF Flux calibrated epsilon Aurigae in red. Intensity vs. wavelength.
Magnified view of the hydrogen alpha line of Almaaz. March 30, 2009
“Epsilon Aurigae - A Spectral Investigation.” Summer 2009 Citizen Sky Workshop