Download
1 / 27
1.68k likes | 5.05k Vues
Economy of the UK. Falling but still strong. UK economy: An introduction (1). The United Kingdom has the fifth largest economy in the world in terms of market exchange rates and the sixth largest by purchasing power parity (PPP). It has the second largest economy in Europe after Germany.

E N D
Economy of the UK Falling but still strong
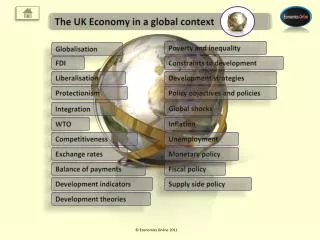
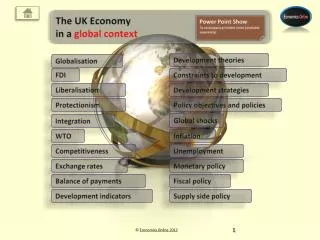
UK economy: An introduction (1) • The United Kingdom has the fifth largesteconomy in the world in terms of market exchange rates and the sixth largest by purchasing power parity (PPP). It has the second largest economy in Europe after Germany. • The United Kingdom is one of the world's most globalised countries, ranking fourth in one recent survey. The capital, London, is one of the three major financial centres of the world, along with New York City and Tokyo. • The British economy is often described as an 'Anglo-Saxon economy'. It is made up of the economies of England, Scotland, Wales and Northern Ireland. The UK has been a member state of the European Union since 1973.
UK economy: An introduction (2) • Privatisation of state-owned enterprises under the Government of Margaret Thatcher in the 1980s. No state-owned enterprises except Royal Mail. • The British economy has in recent years seen the longest period of sustained economic growth in every quarter since 1992. It is one of the strongest EU economies in terms of inflation, interest rates and unemployment, all of which remain relatively low. • Although the UK's “labour productivity per person employed” has been progressing well over the last two decades and has overtaken productivity in Germany, it lags around 20% behind France's level. • The United Kingdom currently ranks 16th on the Human Development Index.
Recent economic growth • The most recent official figure, from the Office for National Statistics, for annual UK GDP growth is 3.1% (2007 compared to 2006). • According to official Treasury estimates, British GDP grew by 2¾% in 2006 and is expected to grow by 3% in 2007. Growth is expected to slow slightly in 2008 to between 2% and 2½%. The forecast for 2009 and 2010 is for the economy to return to trend growth of between 2½% and 3%. • In October 2007, the International Monetary Fund forecast British GDP to grow by 3.1% in 2007 and 2.3% in 2008.
Macroeconomic trend • This is a chart of trend of gross domestic product of United Kingdom at market prices estimated by the International Monetary Fund with figures in millions of British Pounds Sterling. • Year Gross domestic product US dollar exchange ______________________________________________________________________________ 1925 4,466 £0.21 1930 4,572 £0.21 1935 4,676 £0.20 1940 7,117 £0.26 1945 9,816 £0.25 1950 13,162 £0.36 1955 19,264 £0.36 1960 25,678 £0.36 1965 35,781 £0.36 1970 51,515 £0.42 1975 105,773 £0.45 1980 230,695 £0.42 1985 354,952 £0.77 1990 557,300 £0.56 1995 718,383 £0.63 2000 953,576 £0.65 2005 1,209,334 £0.54 ______________________________________________________________________________
Agriculture: Primary Industry • Agriculture and fishing • Agriculture intensive, highly mechanised, and efficient by European standards; producing about 60% of food needs with less than 2% of the labour force. contributing around 2% of GDP; About two-thirds of the production is devoted to livestock, one-third to arable crops; main crops: wheat, barley, oats, oilseed rape, maize for animal feeds, potatoes and sugar beet; main livestock: cattle, chickens and sheep; Agriculture is subsidised by the European Union's Common Agricultural Policy. • Fishing a significant, although vastly reduced, industry fish ranging from sole to herring coastal towns with fishing industries: Kingston upon Hull, Grimsby, Fleetwood, Great Yarmouth, Peterhead, Fraserburgh, and Lowestoft
Sowing and harvesting, no more work!British farmers are blessed
Secondary Industry: Mining and Manufacturing • Office for National Statistics (2003) The importance of the manufacturing industry has been declining since 1960s: Accounting for 16% of national output Accounting for for 13% of employment The sector is still important for overseas trade: Accounting for 83% of exports The regions with the highest proportion of employees in manufacturing: The East Midlands: 19% The West Midlands 18% London had the lowest at 6%
Closing down of mines: a case in Newcastle upon Tyne Miners Heaton Park: Used to be a coal mine • Yesterday: Don’t bring coal to Newcastle.
Engineering: (1) • Engineering and allied industries contribute 30.8% of total Gross Value Added in manufacturing in 2003. • Great contributors within this sector 1. Vehicle manufacturers global car manufacturers BMW (MINI, Rolls-Royce), Ford (Premier Automotive Group), Vauxhall Motors (General Motors), Honda, Nissan, Toyota, Volkswagen (Bentley) 2. Electronics, audio and optical equipment manufacturers Domestic firms: eg. Amstrad, Alba, ARM, Dyson, Glen Dimplex, Invensys, and Linn… Foreign firms manufacturing a wide range of TV, radio and communications products, scientific and optical instruments, electrical machinery and office machinery and computers.
Engineering: (2) • Great contributors within this sector 3. Chemicals and chemical-based product manufacturers The pharmaceutical industry is particularly successful, with the world's second and third largest pharmaceutical firms (GlaxoSmithKline and Astra Zeneca respectively) being based in the UK and having major research and development and manufacturing facilities. 4. Other important sectors of the manufacturing industry include: Food, drink, tobacco, paper, printing, publishing and textiles. Three of the world's biggest brewing companies: Diageo, Sabmiller and Scottish and Newcastle
Service industry: Tertiary industry • UK exports of services in 2005 The service sector is the dominant sector of the UK economy, a feature normally associated with the economy of a developed country. This means that the Tertiary sector jobs outnumber the Secondary and Primary sector jobs combined. • Wholesale and retail trade This sector includes the motor trade, auto repairs, personal and household goods industries. This sector added gross value of £127 billion to the UK economy in 2004. • Hotels and restaurants Adding gross value of £33 billion to the UK economy. • Transport, storage and communication Adding gross value of £49 billion to the UK economy. The communication industry added a gross value of £29,762 million. • Financial intermediation Adding gross value of £86 billion to the UK economy before adjustment of financial services valued at £50 billion
Service industry: Tertiary industry • Real estate and lettings This sector includes letting of dwellings and other related business support activities. The Blue Book 2006 reports that the lettings industry added gross value of £83 billion to the UK economy in 2004 while other real estate and business support activities added gross value of £175 billion. • Public administration and defence Adding gross value of £55 billion to the UK economy • Education Adding gross value of £61 billion to the UK economy UK students (£3000) national students (£9000) • Health and social work Adding gross value of £76 billion to the UK economy • Other social and personal services This sector includes value added by private households with employees and extra-territorial organisations. It added gross value of £56 million to the UK economy
The UK: A financial empire • The United Kingdom had £21bn of financial exports in 2005, contributing significantly towards the Balance of Payments. The UK has had an expanding export business in financial service, which has been influenced by a mixture of unique institutions, light regulation, and a highly skilled workforce. • Important financial cities in the UK • London: the world’s financial center Shares and bonds: London Stock Exchange Insurance: Lloyds of London Central bank: The Bank of England Business banks Barclays Bank, Citigroup and HSBC There are now over 500 banks with offices in the City and Docklands, with the majority of business in London being conducted on an international basis. • Edinburgh: the fifth largest financial centre in Europe the Royal Bank of Scotland (the second largest bank in Europe), HBOS (owners of the Bank of Scotland) and Standard Life Insurance. • Cardiff: has in recent years seen significant growth in its financial industry, due to new start ups, such as Admiral Group, which have set up their main headquarters in the city. • Other cities with large financial districts: Manchester, Leeds and Birmingham.
Service industry: Tertiary industry • Major banks in the UK with Bank of England as the central bank HSBC Bank London Royal Bank of Scotland Edinburgh Barclays Bank London HBOS Edinburgh Lloyds TSB London Standard Chartered London Alliance & Leicester Leicester Northern Rock Newcastle upon Tyne Co-operative Bank Manchester Bradford & Bingley Bingley • Convenience and inconvenience opening an account closed (Sunday and banking holidays) Internet banking cash back ATM money transmission Security: a relative matter • Northern Rock and US Subprime Mortgage Crisis
Pound sterling: A symbol of nationalist character (1) • Pound sterling: The symbol of the UK • Units of the sterling • Coins 1 penny 2 pence 5 pence 10 pence 20 pence 50 pence 1 pound 2 pounds 5 pounds (commemorative only) Notes 5 pounds 10 pounds 20 pounds (seldom) 50 pounds (rarely used) • *On 15 February1971, the U.K. decimalized, replacing the shilling and penny with a single subdivision, the “new penny”. The word "new" was used on coins until 1981.
Pound sterling: A symbol of nationalist character (2) • Joining the single currency, EURO: still a long way to go 1. The Labor Party and Gordon Brown promised to hold a public referendum. 2. Public opinion polls have shown that a majority of Britons have been opposed to joining the single currency for some considerable time. 3. The main opposition party, the Conservative party, are opposed to membership. • Three of 25 member countries of EU do not join EURO: • The UK Sweden Denmark
Pound Sterling: a hard currency Exchange rates against USD $ (and Euro €) ___________________________________________________ Year £/USD USD/£ 1990 £0.5633 $1.775 1991 £0.5675 $1.762 1992 £0.5699 $1.755 1993 £0.6663 $1.501 1994 £0.6536 $1.530 1995 £0.6338 $1.578 1996 £0.6411 $1.560 1997 £0.6106 $1.638 1998 £0.6037 $1.656 £/USD USD/££/EUR EUR/£ 1999 £0.6185 $1.617 £0.6595 €1.516 2000 £0.6609 $1.513 £0.6099 €1.640 2001 £0.6943 $1.440 £0.6223 €1.607 2002 £0.6664 $1.501 £0.6289 €1.590 2003 £0.6123 $1.633 £0.6924 €1.444 2004 £0.5460 $1.831 £0.6788 €1.473 2005 £0.5500 $1.821 £0.6842 €1.463 2006 £0.5426 $1.859 £0.6815 €1.467 2008/10/14£0.5716 $1.749 £0.7819 €1.279 ___________________________________________________
Pound Sterling: a hard currency CPI (Consumer price index)
Regional GDP variation • Regional variation The strength of the UK economy varies from region to region. GDP, and GDP per capita is highest in London. The following table shows the GDP (2004) per capita of the 12 areas. • Rank Place GDP per capita in Euros ——————————————————————————————————————— 1. London, England 44 401 2. South East England 31 300 3. East of England 27 778 4. Scotland 27 669 5. South West England 27 348 6. East Midlands, England 26 863 7. West Midlands, England 25 931 8. North West England 25 396 9. Yorkshire and the Humber, England 25 300 10. Northern Ireland 23 319 11. North East England 22 886 12. Wales 22 567 ———————————————————————————————————————
Ethnic income difference • Rank Average total income by ethnic group _________________________________________ • Rank ethnic group Average total income 1 Indian £30,211 2 Chinese £25,964 3 White £24,756 4 National average £24,568 5 Any other ethnic group £23,350 6 BlackAfrican £23,109 7 Black Caribbean £22,902 8 Bangladeshi £18,407 9 Pakistani £18,209 ______________________________________________
Taxation and expenditure • Taxation • Taxation paid to both local government and central government Local government is financed by grants from central government funds, business rates, council tax and increasingly from fees and charges such as those from on-street parking. Central government revenues are mainly income tax, national insurance contributions, value added tax, corporation tax and fuel duty. ________________________________________ Year Tax 1975/6 54% 1985/6 44% 1995/6 43% 2005/6 46% ________________________________________ These data show the tax burden (personal and corporate) as a percentage of GDP.
A pie chart showing the projected constituents of UK taxation receipts for the tax year 2008-2009, according to the 2008 Budget.
UK income tax and National Insurance charges (2008–2009), prior to changes on 13 May 2008
UK central government expenditure projection for tax year 2008-2009