Download
1 / 283
2.85k likes | 3.18k Vues
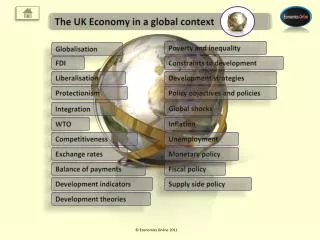
Power Point Show To accompany printable notes (available separately). Development theories. Globalisation. FDI. Constraints to development. Liberalisation. Development strategies. The UK Economy in a global context. Protectionism. Policy objectives and policies. Global shocks.

E N D
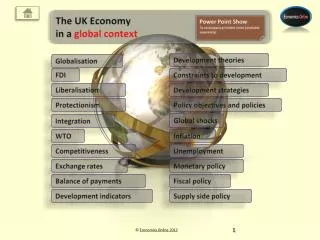
Power Point Show To accompany printable notes (available separately) Development theories Globalisation FDI Constraints to development Liberalisation Development strategies The UK Economy in a global context Protectionism Policy objectives and policies Global shocks Integration WTO Inflation Competitiveness Unemployment Exchange rates Monetary policy Balance of payments Fiscal policy Development indicators Supply side policy
Globalisation • Globalisation is the integration of markets in the world economy. Markets where globalisation is particularly common include: • Financial markets, including capital, money and insurance markets. • Commodity markets, such as markets for oil and coffee. • Product markets, such as markets for motor vehicles and consumer electronics.
Globalisation • Factors leading to globalisation • Developments in transport and communications – for example, the internet has enabled fast and 24/7 global communication. • Common technology - global firms use common IT systems helping to integrate their global operations. • Capital mobility - when capital can move freely from country to country, it is easier for firms to locate and invest abroad, and repatriate profits. • Free and open trade – the relative success of the World Trade Organisation (WTO), and the collapse of communism. • Over the last 30 years, trade openness, which is defined as the ratio of exports and imports to national income, has risen from 25% to around 40% for industrialised economies, and from 15% to 60% for emerging economies. (Source: The Bank of England, 2006) • Growth of powerful multi-national companies (MNCs) - there has been a rise in significance of ‘global brands’
Globalisation • The benefits of globalisation for firms • Access to larger markets so that firms can benefit from increased demand, and economies of scale. • Worldwide access to the cheapest sources of raw materials, which make firms more cost competitive. • Increased profit for shareholders of MNCs. • Avoidance of regulation by locating production in countries with softer regulatory regimes, such as those in some developing economies.
Benefits to countries: • If trade is free, then countries can benefit from the application of the principle of comparative advantage. • New trade can be created, a process called trade creation. • Benefits of inward investment to recipient countries, such as sharing knowledge between firms in different countries. • The macro-economic benefits of increased investment. • Job creation in the more competitive countries.
The costs of globalisation • The over-standardisation of products through global branding, such as Microsoft’s Windows, leading to a lack of product diversity. • Diseconomies of scale for large firms, such as difficulties co-ordinating the activities of firms that operate in many countries. • Increased power and influence MNCs - MNCs can move their investments between territories - MNCs can be local monopsoniesof labour, and push wages lower than the free market equilibrium. • Loss of jobs in domestic markets because of increased, and in some cases unfair free trade. • Loss of jobs caused through structural unemployment, causing a widening gap between rich and poor within a particular country.
Thecosts of globalisation • Increased risks associated with interdependence of economies: • Because countries are increasingly dependent on each other, a negative shock in one country can quickly spread to other countries – e.g. the recent credit crunch. • Over-specialisation - countries can become over-reliant on producing a limited range of goods for the global market. Many LDCs suffer by over-specialising in a limited range of products, such as agriculture and tourism. • Possible increased inequality as richer nations benefit relative to poorer nations, as suggested in the Kuznets Curve. • Increased trade associated with globalisation has increased pollution and helped contribute to CO2 emissions and global warming. It has also accelerated the depletion of non-renewable energy resources, such as oil. • The increased risks of globalisation partly explains the popularity of regional trading blocks, and the rise of protectionism.
De-globalisation • The effects of the financial crisis Since the financial crisis, recession and Euro zone debt crisis, the volume of world trade and investment flows has fallen. Some have called this process de-globalisation. • Features of de-globalisation • Inward looking attitude and policies • Increased protectionism • Reduction in trade ‘openness’ (ratio of exports plus imports/GDP) • Reduction in FDI
Inequality and development • The Kuznetscurve • Globalisation may widen the gap between rich and poor countries. • The greatest inequality can be observed as countries 'take-off' in their development, leading to considerable wealth creation for the few, who quickly gain from development, relative to others. Inequality increases in the early stages of development Kuznets Curve Development Inequality
Foreign direct investment (FDI) • FDI is the flow of real capital between countries, and is undertaken by private sector firms and by governments. • A large proportion of FDI is associated with cross-border mergers between private firms. • The benefitsto firms of investing abroad • Reduction in transport costs - locating within a foreign market reduces transport costs to that market, especially for ‘bulk increasing’ products. • Access to the country’s markets. • Access to cheap labour and to skilled labour. • Access to local knowledge and expertise. • Exploitation of economies of scope, especially managerial economies, where fixed management costs can be spread between territories. • Avoidance of barriers to trade, such as tariffs and quotas.
Investment income • Increased investment income - outward investment can lead to increased overseas investment income for a country, such as: • Profits from overseas subsidiaries. • Dividends from owning shares in overseas firms. • Interestpayments from lending abroad. • FDI in the balance of payments accounts • The initial outflow is a debit on the capital account, and the investment income is entered as a credit on the current account.
Inward investment • Countries receiving inward investment gainthrough: • An increase in GDP, initially through the FDI itself, followed by a positive multiplier effect on the receiving economy. • The creation of jobs. • An increase in productive capacity – this can be illustrated by a shift to the right in the Aggregate Supply (AS) or the Production Possibility Frontier (PPF). • Producers have access to the latest technology from abroad. • Less need to import because goods are produced in the domestic economy. • The positive effect on the country’s capital account. FDI represents an inflow, or credit, on the capital account.
Who invests? The USA, France and the UK are the three most important international investors, and recipients of investment.
Share of EU inward investment • EU inward investment • The UK receives 22% of all inward investment into the EU(2003). • There are over 18,000 different investors into the UK, with 1.8mpeople are directly ‘supported’ by inward investment. • Overseas firms account for around 40% of the top 100 UK exporters. Source – HSBC, 2005
Volatility During the global recession, FDI fell as liquidity tightened and confidence took a severe hit. Some argue that this may trigger a period of de-globalisation. RECESSION
Why is FDI volatile? • FDI is highly volatile - possible causes are: • Fluctuations in exchange rates. • Fluctuations in interest rates and other monetary policy. • Changes in the trade cycle – growth in an economy may encourage FDI, but recession will deter it. • Expectations about the future. • Changes in business regulation – tighter or looser. • Changes in the level of business taxes. • Relative wage rates and changes in the minimum wage. • Inducements and incentives by host countries. • Changes of government and political stability.
Liberalisation and protectionism • Two opposing forces have shaped the changing pattern of world trade over the last 200 years. • Trade liberalisation - this is the process of making trade free of barriers such as tariffs and quotas. • Protectionism - protectionism is the process of erecting barriers to trade. • Protectionism may be on the increase as a result of the global economic crisis and recession.
International specialisation • The fundamental principals of free trade • Economic production in market economies is based on two fundamental principles, first analysed by Adam Smith in the late 18th Century. • These are: • The division of labour, where production is broken down into small, interconnected tasks. • Specialisation -where factors of production are given unique jobs - can be applied to individuals, firms and countries.
Specialisation is the basis of free trade • Countries trade because they do not have all the goods, services and resources they need, and buy imports. • To pay for these imports countries must export goods, services and resources that other countries need. • Countries can become increasingly specialist in producing particular goods, services and resources, and this makes them more efficient over time. • Efficiency reduces costs and gives the country a cost advantage, which makes it more competitive.
Comparative advantage • It can be argued that world output will increase when the principle of comparative advantage is applied by countries to determine what goods and services they should specialise in producing. • Comparative advantage is a term associated with 19th Century English economist David Ricardo. • Ricardo argued that countries should specialise in producing goods for which they have a comparative advantage. • Absolute advantage means being more productive and competitive than another country – comparative advantage concerns how muchbetter one country is than another.
Comparative advantage • Consider the simple example of two countries producing only two goods: • Using all its resources, Country A can produce 10m cars or 5m vans, and Country B can produce 20m cars or 7.5m vans. • Should they trade? • Economic theory suggests that they should trade because both countries have a comparative advantage. 10m 20m 5m 7.5m
Using PPFs to show ‘advantage’ • Production possibility frontiers can be used to illustrate cost advantage. • Country B’s PPF is further outward and indicates it has an absolute advantage in both goods. • But it has a comparative advantage in cars because it can produce twice as many, so B should specialise in producing cars. Comparative advantage Absolute advantage Twice as productive Country B Country A 0 Only 50% more productive
Numerical example • If countries do not specialise, and allocate resources evenly to both goods, world output is: • Cars = 10 + 5 = 15 • Vans = 3.75 + 2.5 = 6.25 • = 21.25 million units • If countries specialise and employ the principle of comparative advantage: • Cars = 20 • Vans = 5 • = 25 million units • However, this analysis does not take into account how transport would increase the costs of trade. 20 15 • Country B 10 • Country A 5 2.5 0 5 1.0 2.5 3.75 7.5
Opportunity cost ratios • We saw earlier that the gradient of a PPF reflects the opportunity cost of increasing production of one good in relation to another - the lost output of X as a result of increasing output of Y. • If two countries’ PPFs, in terms of two goods, have different gradients then they must have different opportunity costs. • Only when the gradients are different will one country have a comparative advantage, and only then will trade be beneficial.
Opportunity cost and PPF gradients What happens if both countries increase their output of copper ore by 10 m tonnes? 50 Atlantissacrifices the least (-5) with Mythica sacrificing 10, hence Atlantis has the comparative advantage in copper production. 40 • Mythica 30 - 10 20 10 - 5 • Atlantis 0 10 20 30 40 50 + 10 • Countries should specialise in producing goods for which they have the comparative advantage. • Take the example of two countries that can produce either computers or copper ore. • Production possibility frontiers illustrate their maximum outputs.
Opportunity cost and PPF gradients 50 Mythicasacrifices the least (- 10) with Atlantis sacrificing 20, hence Mythica has the comparative advantage in computer production. 40 30 20 + 10 • Atlantis • Mythica 10 0 10 20 30 40 50 - 20 - 10 • If we reverse the analysis, Mythica loses the least by increasing its output of computers. • Hence, to achieve the best outcome for both countries, each should specialise and trade with the other country.
The benefitsand costs of free trade • The benefits • Applying the principle of comparative advantage means producing in higher volumes for the export market as well as the domestic market, which leads to the benefit of economies of scale. • Increased competition and lower world prices. • Welfare gains (including increased consumer surplus). • Trade creation. • The breakdown of domestic monopolies. • Increased quality of goods and services. • More employment as (efficient) domestic firms can sell to the global market and jobs are created.
The costs • Over-specialisation - workers risk losing their jobs when world demand changes (structural unemployment). • Exhaustion of non-renewables. • Industries can be destroyed, including: • Infant industries • Declining industries • Inefficient industries • Strategic industries • Welfare loss associated with loss of trade for domestic producers (loss of producer surplus).
Motives for protection • Why engage in protection? • Despite the arguments in favour of free trade protectionism is still widely practiced. The main arguments for protection are: • To protect sunrise industries - also known as infant industries, such as those involving new technologies. • To protect sunset industries - also known as declining industries, such as steel production. • To protect strategic industries - such as energy, water, steel, and armaments. • To protect a resource which is non-renewable, as in the case of oil. • To deter unfair competition – such as to protect from dumping at prices below cost. • To save jobs.
Motives for protection • Some countries may protect themselves from trade to help ‘save’ their environment -such as from CO2 emissions caused by increased freight transport. • Most economists argue that there are dangers in over-specialisation. The recent global crisis has led to more ‘nationalism’, and raised concerns about free trade and globalisation. • The theory of comparative advantage is too unrealisticto apply to the real world, and fails to take into account: • Transport costs • Exchange rates • Imperfect competition • Imperfect knowledge
Methods of protection There are two types of protection: • Tariffs - tariffs are taxes, or duties, on imported goods designed to raise the price to the level of, or above the existing domestic price. • Non-tariff barriers – which include all other barriers, such as: • Quotas - which are physical limits on the volume of imports. • Public procurement policies – where national governments favour local firms, such as where a country’s police or ambulance service purchase only locally produced vehicles. • General subsidies to domestic firms, which can be used to help reduce price and deter imports - this financial support can also be in the form of an export subsidy, making it easier for firms to export. • Health and safety – such as banning imports of unsafe electrical goods. • Excessive bureaucracy – such as deliberately delaying goods at ports and airports, or unnecessarily complex and length paperwork associated with trade.
Quotas The effect of the quota is to shift the domestic supply curve to the right, by the amount of the quota X to Y is the expanded domestic supply as a result of the price increase from P1 to Pq • A quota is a physical limit on imports. • The no-trade price and quantity are P and Q. • The free trade price and quantity are P1 andQ1. • A quota of Q2 - Q limits imports and encourages domestic firms to supply more as the price is pushed up to Pq. • Imports fall to the quota level, and total supply is Q4. Domestic supply Domestic supply + quota P Y Y Pq X X World supply P1 Domestic supply Domestic supply Imports (QUOTA) Imports QUOTA Domestic supply Domestic Demand 0 Q2 Q Q4 Q1
Tariffs • Tariffs are taxes on imported products, usually in an ad valorem form. They are also called ‘customs duties’. • The impact of tariffs • Domestic consumers face higher prices and lower consumer surplus. • Domestic producers receive higher prices and higher producer surplus – but there is likely to be an overall net welfare loss, which can be seen later. • There is a distortionof the principle of comparative advantage. • There is the likelihood of retaliation from exporting countries, which could trigger a costly trade war. • However, in the short run tariffs may protect jobs, infant and declining industries, and strategic goods. • Selective tariffs may also help reduce a trade deficit, and reduce consumption of de-merit good , such as imported tobacco.
The Tariff diagram However, consumer surplus falls by more than producer surplus increases - even adding in tariff revenue there is still a net loss. The net welfare loss is represented by the triangles X and Y. • Without trade, domestic price and quantity are Pand Q. • If an economy opens up to world supply, price falls to P1, Q increases to Q2 - domestic producers’ share falls to Q1! • The imposition of a tariff causes price to rise, imports to fall, domestic producer’s share of the market, and producer surplus, to increase. Domestic Supply Consumer Surplus P Producer Surplus World Supply + Tariff P2 Tariff Revenue World Supply X Y P1 Domestic supply Domestic supply Imports Domestic Demand 0 Q1 Q4 Q Q3 Q2
Costs and benefits of trading blocs • The main benefits for members of blocs: • Members can specialise, knowing that they have free access to others member’s markets. This means there is a more complete application of the principle of comparative advantage. • Easier access to each other’s markets means that trade between members is likely to increase - trade creation. • Producers can benefit from the application of scale economies, which will lead to lower costs and lower prices for consumers. • Jobs may be created in member economies. • Protection from countries outside the bloc • Firms inside the bloc can be protected from cheaper imports from outside.
Trade creation • With a tariff, the prevailingdomestic price and quantity are P1 and Q1. • Domestic market share is 0 – Q4, and imports are Q4 – Q1. • If an economy joins a customs union it must eliminate tariffs. This increases imports, from Q3 to Q2. • Trade is created, from Q1 to Q2. • Welfare is gained (X + Y) Domestic Supply P World Supply + Tariff P1 X Y World Supply World Supply P2 Domestic supply Domestic supply Imports Domestic Demand 0 Q3 Q4 Q Q1 Q2
Costs and benefits of trading blocs • Trading blocs can generate the following costs: • Loss of benefits of free trade • World trade is distorted, and comparative advantage cannot be fully exploited at the global level. • Retaliation and trade disputes • The development of one regional trading bloc is likely to stimulate the development of others, which can lead to trade disputes, such as those between the EU and NAFTA, including the long running EU/US steel dispute, banana wars, and the Boeing (US)/Airbus (EU) dispute. • Inefficiencies and trade diversion • Inefficient producers inside the bloc can be protected from more efficient ones outside the bloc. • Trade is diverted from efficient global producers.
Stages in economic integration Full economic integration A common market, a single currency, central bank, and common monetary and fiscal policies Monetary Union (MU) Members share a single currency, central bank, and have a common monetary policy Members eliminate tariffs on all resources, allowing free movement of labour and capital, and common micro-economic policies Common market – a single market Members eliminate tariffs on some goods Members eliminate tariffs on all goods Members eliminate tariffs on all goods and services, and have a common external tariff to non-members Preferential trade area (PTA) Free trade area (FTA) Customs Union (CU) Integration
Regional trading blocs (RTBs) • A trading bloc is a group of countries that protect themselves from imports from non-members. There are several types: • Preferential Trade Area (PTA) • Members eliminated tariffs on some goods • Free Trade Areas (FTAs) • Members eliminated tariffs on all goods • But they do not have a common external tariffagainst non-members • Example - North Atlantic Free Trade Area (NAFTA) (USA, Canada and Mexico)
Regional trading blocs (RTBs) • Customs Unions • These also aim to reduce or eliminate tariffs between members • But they do have a common external tariff - a common external tariff means that members must set the same level of tariff against a non-member • Common Market • Members eliminate tariffs on all resources, allowing free movement of labour and capital, and common micro-economic policies • Further integration • Bloc members can also integrate further by adopting a common currency and common monetary system, including a common central bank and monetary policy (as in the Eurozone). • Beyond this, members can create a fiscal union or fiscal pact, with common taxation and spending policies
The European Union (EU) • The EU - originally called Common Market – was formed in 1957, following the Treaty of Rome. • The EU has evolved through stages of integration. • The aim was to create one market for all products, capital and labour, by eliminating trade barriers. • By 2007, following continuous enlargement the EU had 27 members.
The Common Agricultural Policy (CAP) • The EU protects its farmers and growers through its Common Agricultural Policy (CAP). • Through the CAP European farmers received annual subsidies of around €43 billion (2010). • The evolution of CAP • CAP was created to ensure continuous food supplies for Europe, and to provide a fair income for European farmers. • Price support schemes, such as guaranteed prices, were first introduced in 1962. • By the mid 1980s, over-production created massive surpluses and this led to major reforms, including the use of set-aside programmes. • By the early 1990s there was a movement away from guaranteed prices towards direct subsidies to farmers, irrespective of the output they produced.
The Common Agricultural Policy (CAP) • The Fischler Reforms, of 2003, continued the process of decoupling subsidies and farm output, and introduced a greenelement to CAP, forcing farmers to meet environmental and animal welfare standards. • Single Farm Payments (SFP) were introduced in 2005, and set-aside programmes were abolished in 2009. • The UK receives a controversial rebate against payments into the EU to compensate for that fact that it receives relatively little income from CAP in comparison with France and Spain.
The European monetary system • The main features of the European Monetary System include: • A single currency, the Euro € - introduced in 2000, with national currencies scrapped in 2002. • An independent central bank, the European Central Bank (ECB) - responsible for monetary stability in the Euro Area (Euro-17). • A single interest rate - the ECB sets interest rates for the whole Euro area – no country has the ability to alter its own interest rate. • The European Financial Stability Facility – introduced in 2010 in response to the Eurozone debt crisis. • The co-ordination of macro-economic policies - the aim of policymakers is to converge the Euro economies. • The Stability Pact - all members originally agree to keep their budget deficits under control. Under the rules deficits must be no more than 3% of GDP. This rule was designed to limit the use of fiscal policy which might de-stabilise the economy and weaken the Euro.
The case for the Euro • Transparency • The prices of goods, services and materials can be compared and workers can compare wages, and move to take advantage of higher wages. • Lower transaction costs • There are no commissions to financial intermediaries. • Certaintyand investment • Firms can predict the cost of imported raw materials and can set the price of their exports. This means can plan ahead and are more likely to invest. • Trade creation • Trade between members is more likely to increase because of the greater confidence of trading with a member in comparison with a non-member. • Job creation • With greater trade there should be more jobs. • Discipline • Members cannot use devaluation to ‘hide’ domestic inflation.
The case against the Euro • Loss of economic sovereignty • The Bank of England will not be free to stabilise the UK economy by using interest rates – they are under the control of the ECB. • Convergence problems • The UK will find it hard to converge with Europe, because of the uniqueness of the UK housing market, and because of the closeness of the UK trade cycle to the USA, rather than the EU. • Only one interest rate • Having only one interest rate is not sensible when dealing with a diverse range of economies and economic circumstances.