Download
1 / 47
480 likes | 578 Vues
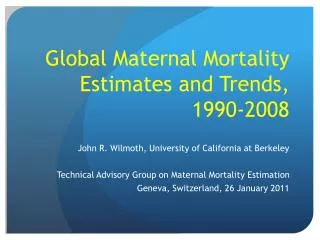
This study examines the impact of race and socioeconomic status on infant mortality rates, analyzing data from Massachusetts birth records from 2004-2007 and Census 2000. Key questions include disparities in IMR by race, ethnicity, education, and poverty level. Significant findings reveal varying levels of excess risk and disparities in IMR, shedding light on persistent inequalities in infant health outcomes.

E N D
Inequalities in Infant Mortality: The Interaction of Race and Socioeconomic Status I Caceres and B Cohen Division of Research and Epidemiology Bureau of Health Information, Statistics, Research and Evaluation Massachusetts Department of Public Health Gateway to the Future: Improving the National Vital Statistics System St. Louis, MO June 6th – June 10th, 2010
Outline • Study Questions • Methods • Background • Results • Summary
Study Questions • Do Race/Ethnicity differences in IMR persist after accounting for SES? • Does the difference depend on SES measures used (Birth certificate education vs Census poverty level)? • Is there race variation in infant mortality by education? • Is there ethnicity variation in infant mortality by education? • Is there race variation in infant mortality by level of poverty? • Is there ethnicity variation in infant mortality by level of poverty?
Data sources: MA Births 2004-2007 Census 2000 Study Outcome Infant mortality rate (IMR) Number of deaths within first year of live in a given period per 1000 live births in the same period Methods
Race: White non-Hispanic (reference group) Hispanics Black non-Hispanics Asian non-Hispanics Ethnicity: 21 ethnicity groups, Euro-American (reference group) Education: Less than high school (<HS) High school (HS) Associated Degree/Some college (Assoc/some college) College or graduate (Coll+) (reference group: most educated) Methods
Methods Area of residence: 11-digit census tract Neighborhood poverty levelis the percent of population in census tract below the Census 2000 federally-defined poverty line, four categories are defined: < 5% (reference: least poor neighborhood) 5- 9.9% 10-19.9% 20-100%
Methods Disparities are measured using ratio of rates for each group to that of the reference group • Race Disparities (ref: WNH) • Ethnicity Disparities (ref: Euro-American) • Education disparities (ref: most educated) • Poverty Disparities: (ref: least poor neighborhood) 95% Confidence intervals of ratios are used to identify significant disparities (or excess of risk) compared with that of the reference group
-5.4%* APC Infant Mortality Rate (IMR)Massachusetts: 1990-2008 1996 * Statistically Significant(p ≤.05) APC = Annual Percentage Change
Race Disparities in IMR by Race Ratio of rates in excess to 1 (relative to NH Whites) Reference: White non-Hispanics Excess risk * * ** * RATIO Statistically higher than 1 (p<.05) ** RATIO Statistically lower than 1 (p<.05)
IMR by Ethnicity Massachusetts Births Infant deaths per 1000 live births
Ethnicity Disparities in IMR Ratio of rates in excess to 1 (relative to Euro-American) Reference: Euro-American Excess risk * * * * * * * RATIO Statistically higher than 1 (p<.05) ** RATIO Statistically lower than 1 (p<.05) ** **
Disparities in IMR by Education Ratio of rates in excess to 1 (relative to most educated: Coll+) Excess risk Reference: Coll+ * * * * RATIO Statistically higher than 1 (p<.05) ** RATIO Statistically lower than 1 (p<.05)
Education Disparities in IMR by Race Ratio of rates in excess to 1 (relative to most educated: Coll+) Reference: Coll+ Excess risk * * * * * * * * RATIO Statistically higher than 1 (p<.05)
Disparities in IMR by Race and Education Ratio of rates in excess to 1 (relative to NH Whites) Reference: White non-Hispanics Excess risk * * * * * ** * RATIO Statistically higher than 1 (p<.05) ** RATIO Statistically lower than 1 (p<.05)
Education, Ethnicity, and Infant Mortality
Births by Education and Ethnicity Most Educated Least Educated % of Total Births (61%) (6%) (2%) (3%) (1%)
Births by Education and Ethnicity MostEducated LeastEducated % of Total Births (4%) (2%) (1%) (2%) (2%)
Infant Deaths by Education and Ethnicity Most Educated Least Educated % of Total Infant deaths (51%) (10%) (3%) (2%) (2%)
Infant Deaths by Education and Ethnicity Most Educated Least Educated % of Total Infant deaths (9%) (3%) (3%) (1%) (1%)
Disparities in IMR by Ethnicity and Education Reference: Euro-American Ratio of rates in excess to 1 (relative to Euro-American) Excess risk * * * * * * * * * RATIO Statistically higher than 1 (p<.05) ** RATIO Statistically lower than 1 (p<.05) *
Percent of Population in Census Tract Below Poverty Level1 Least poor Most poor 1. Categories of ‘below poverty level’ in census tracts (or in neighborhood areas) are based on percent of population in these areas below the Census 2000 federally-defined poverty line.
IMR by Neighborhood Poverty Level Infant deaths per 1000 live births
IMR by Neighborhood Poverty Level Ratio of rates in excess to 1 (relative to least poor neighborhood) Reference: neighborhoods with <5% in poverty Excess risk * * * * RATIO Statistically higher than 1 (p<.05)
Distribution of Neighborhood Poverty Level Births vs. Infant Deaths Leastpoor 47% Mostpoor
Births by Neighborhood Poverty Level and Race Least poor 51% Mostpoor % of Total Births (70%) (7%) (8%) (13%) * Non-Hispanic.
Infant Deaths by Neighborhood Poverty Level and Race Leastpoor 68% Most poor % of Total Infant deaths (59%) (4%) (17%) (17%) * Non-Hispanic.
IMR by Neighborhood Poverty Level and Race Ratio of rates in excess to 1 (most poor to least poor neighborhood) Reference: neighborhoods with <5% in poverty Excess risk * * * * RATIO Statistically higher than 1 (p<.05)
Race Disparities in IMR by Neighborhood Poverty Level Ratio of rates in excess to 1 (relative to NH Whites) Reference: White non-Hispanics Excess risk * * * * ** * RATIO Statistically higher than 1 (p<.05) ** RATIO Statistically lower than 1 (p<.05) **
Births by Neighborhood Poverty Level by Ethnicity Leastpoor Most poor % of Total Births (61%) (6%) (2%) (3%) (1%)
Births by Neighborhood Poverty Level by Ethnicity Leastpoor Most poor % of Total Births (4%) (2%) (1%) (2%) (2%)
Infant Deaths by Neighborhood Poverty Level and Ethnicity Least poor Most poor % of Total Infant deaths (51%) (10%) (3%) (2%) (2%)
Infant Deaths by Neighborhood Poverty Level and Ethnicity Leastpoor Most poor % of Total Infant deaths (9%) (3%) (3%) (1%) (1%)
Ethnicity Disparities in IMR by Neighborhood Poverty Level Ratio of rates in excess to 1 (relative to Euro-American) Reference: Euro-American Excess risk * * * * * * * * RATIO Statistically higher than 1 (p<.05) ** RATIO Statistically lower than 1 (p<.05) *
One out of 2 infant deaths are to mothers with high school education or less • One out of 4 infant deaths are to mothers living in poor neighborhoods, however 2 out 3 infant deaths to Hispanic mothers are to those living in poor neighborhoods
Race and neighborhood poverty disparities are more influential in excess of risk of infant mortality among Black non-Hispanic mothers • More educated BNH mothers have equal risk of IMR than their least educated counterparts • For White non-Hispanic and Hispanic mothers, increasing levels of educational attainment diminishes their risk of IMR
BNH, Hispanics, and WNH mothers living in poor neighborhoods have an excess risk of IMR compared to those living in most affluent neighborhoods • Asian mothers have a lower risk in IMR compared with WNH mothers. However, Asian mothers with less than high school education have an excess risk of IMR than that of their counterparts with college or more education
Public Health Implications • Clearly, IMR reduction strategies need to focus on lower SES families whether defined by individual education or areal poverty • More needs to be done to understand the mechanisms that drive excess of risk in IMR across all levels of education and across all levels of neighborhood affluence particularly among BNH mothers, compared with that of WNH mothers
Public Health Implications • We need to further explore the interaction of race and poverty to better target perinatal programs • We need to collect more detailed ethnicity data to better understand patterns obscured by broad race groups