
Agricultural Crop Needs Analysis by County in North Carolina
This document analyzes the varying water and nutrient needs of crops across different counties in North Carolina, highlighting regions that fall within specific ranges from 0% to over 100% of their crop requirements. It serves as a visual tool to help farmers and agribusinesses understand and adapt to the agricultural demands in their respective areas, allowing for enhanced productivity and resource management. The data, displayed on a color-coded map, informs about optimal conditions for crop growth, aiming for sustainable agricultural practices across counties.

Agricultural Crop Needs Analysis by County in North Carolina
E N D
Presentation Transcript
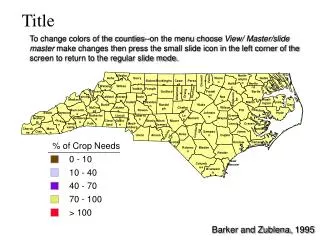
% of Crop Needs 0 - 10 10 - 40 40 - 70 70 - 100 > 100 To change colors of the counties--on the menu choose View/ Master/slide master make changes then press the small slide icon in the left corner of the screen to return to the regular slide mode. Title Alleghany North-ampton Currituck Ashe Surry Warren Gates Camden Vance Stokes Rockingham Caswell Person Granville Pasquotank Halifax Hertford Perquimans Watauga Wilkes Yadkin Forsyth Chowan Avery Guilford Franklin Bertie Durham Allamance Orange Mitchell Yancey Caldwell Alexander Davie Nash Edgecombe Madison Wash-ington Iredell Davidson Martin Tyrell Burke Randolph Wake Dare McDowell Catawab Chatham Wilson Buncombe Rowan Pitt Beaufort Swain Haywood Johnston Hyde Rutherford Lincoln Cabarrus Lee Greene Graham Henderson Harnett Wayne Jackson Cleve-land Gaston Stanly Mont-Gomery Moore Beaufort Transyl-vania Polk Meck-lenburgh Lenoir Craven Cherokee Macon Pamilco Cumberland Clay Sampson Jones Hoke Richmond Union Anson Duplin Scotland Onslow Carteret Robeson Bladen Pender New Hanover Columbus Brunswick Barker and Zublena, 1995


