Download
1 / 30
300 likes | 387 Vues
Learn about Census Bureau sources of income and poverty estimates, health insurance coverage estimates, and tools for accessing data. Explore definitions of income and poverty levels, differences between ACS and CPS, and strengths of Small Area Income and Poverty Estimates (SAIPE).

E N D
Measures of Income, Poverty and Health Insurance Wesley Basel, U.S. Census Bureau Presented at the Walter Cronkite School of Journalism June 17, 2011 00:00
Outline • Census Bureau Sources of Income and Poverty Estimates • Census Bureau Sources of Health Insurance Coverage Estimates • Examples and Tools for Accessing the Data This report is released to inform interested parties of ongoing research and to encourage discussion of work in progress. The views expressed on statistical issues are those of the authors and not necessarily those of the U.S. Census Bureau. 00:47
Income and Poverty 1:25
Census Bureau Sources of Income and Poverty Estimates • Annual Social and Economic Supplement of the Current Population Survey (CPS-ASEC) • American Community Survey (ACS) • Survey of Income and Program Participation (SIPP) • Small Area Income and Poverty Estimates (SAIPE) 1:28
Definition of Income • Only collects money income – does not count noncash benefits • Income is generally counted before payment for income taxes, social security, etc. 2:28
Census Income Components (1) • Money income includes • Wages and Salary Income • Self-Employment Income • Interest and Dividends • Social Security Income • Supplemental Security Income • Public Assistance Income • Retirement Income • Other Income 3:09
Census Income Components (2) • Money income excludes: • Government noncash transfers • Employee fringe benefits • Taxes • Lump-sum payments • Capital gains or losses • Intra-household transfers 3:28
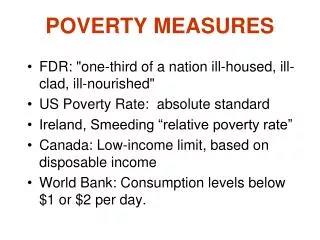
Definition of the Federal Poverty Level • A FAMILY, and all individuals in the family, are in poverty if their TOTAL MONEY INCOME is less than the POVERTY THRESHOLD for the family size and age composition Poverty universe excludes unrelated persons under age 15, and all persons in institutions, dorms or barracks. 4:08
CPS ASEC • Source of official national poverty estimates • Sample size/design: 100,000 addresses, state-representative • Computer-assisted telephone/personal interviews (CATI/CAPI) • Conducted in February-April and questions refer to previous calendar year • Detailed questionnaire (over 50 different sources of income can be reported) 6:43
ACS • Part of Decennial Census Program • Sample size--2005 and forward: 3 million addresses annually • Mailout/Mailback survey with CATI/CAPI followup • Conducted throughout the year and questions refer to previous 12 months—overall reference period spans almost 2 years • Broad income questions (8 questions on sources of income) 7:55
ACS/CPS Similarities • Both conducted by the Census Bureau • Both utilize same concept of money income • General trends track consistently 9:29
ACS/CPS Differences • Sample size/Level of sampling error • Questionnaire detail • Mode of collection • Reference period • Family Composition 9:57
ACS/CPS Strengths • ACS: • Very reliable sub-national and sub-state estimates/rankings • Estimates for small population groups • More subject area coverage (housing) • CPS ASEC: • Long-term national income/poverty trends • Strong on employment–related issues 11:15
Small Area Income and Poverty Estimates (SAIPE) • SAIPE poverty estimates for school-age children ages 5-17 is a key input for the Dept. of Education’s Title I allocation process. • Used by other allocation programs that need a reliable, recent estimates for all counties or school districts. 11:47
Estimates Produced by SAIPE for States and Counties • All people in poverty • Children under age 18 in poverty • Related children ages 5 - 17 in poverty • Children under age 5 in poverty (states only) • Median household income 13:50
Estimates Produced by SAIPE for School Districts • Total Population • Related children ages 5 - 17 • Related children ages 5 - 17 in poverty 14:17
ACS/SAIPE Strengths • ACS • Hundreds of different concepts, all estimated from the same survey sample and methodology. • Variety of demographic detail: age, sex and race. • SAIPE • Timeliness. All counties and school districts have same time reference, the most current ACS year. • Precision. Smaller domains have lower variance than ACS single-year estimates. • Guidance for significance of year-to-year changes 14:46
ACS Health Insurance Question, 2009 Source: the 2009 American Community Survey, Question 16 19:32
CPS/ACS Differences • Coverage • ACS – current coverage • CPS – any coverage during the past calendar year • Specified Types • ACS – seven groupings of insurance types • CPS – up to twelve types specified • Collection mode • Historical Series • CPS since 1999 in current version • ACS since 2008, not yet available for every area 20:30
Small Area Health Insurance Estimates (SAHIE) • Health insurance coverage estimates by detailed characteristics and Income-to-Poverty Ratios (IPR). • • Centers for Disease Control and Prevention (CDC) • •State level: • – 4 ages: 0-17, 18-39, 40-49, 50-64 • – 4 race/ethnicity groups • – sex • – 3 income groups: 0-200%, 200-250%, 250+% IPR • •County level: • – 3 ages: 0-17, 18-39, 40-64 • – sex • – 2 income groups: either 0-200% and 200+% or 0-250% and 250+% 21:47
American FactFinder for ACS Health Insurance • Uninsured by characteristic • Race by Age (B27001[A-I] and C27) • Sex (B27001 and C27) • Coverage type by Sex by Age (B27002-B27010 and C27) • Coverage status and by Income to Poverty level (B27016-18 and C27) • Others (e.g., Employment status, Educational Attainment, Citizenship, Living Arrangement) • http://www.census.gov/hhes/www/hlthins/data/acs/aff.html 23:13
What Source should I Use? • Long-term trends – anything over 5 years • Use CPS • Break-outs by detailed demographic characteristics • National – Use CPS • State and Large Counties, current year - Use ACS • Counties and sub-county, multi-year – Use ACS • Break-outs by a few key demographic characteristics • Small Areas - Use SAIPE or SAHIE • Use One Source – for any given project, determine the single, appropriate source for the analysis. Comparison between sources is not valid. 23:25
Demos for Accessing Data • Table generator for CPS • American FactFinder for ACS one, three and five-year • Table generator for SAIPE and SAHIE • Interactive poverty maps for SAIPE 24:45
For more information • Income Portal • http://www.census.gov/hhes/www/income/income.html • Poverty Portal • http://www.census.gov/hhes/www/poverty/poverty.html • Health Insurance Portal • http://www.census.gov/hhes/www/hlthins/index.html • If you have further questions, please contact us at 301-763-3030 or pio@census.gov