Download
1 / 17
170 likes | 279 Vues
Is there an „industry bias“ in private investing?. Katharina Sachse TU Berlin Germany. Presentation at IAREP 2008, Rome, Italy. Stock XYZ. Bid: 24,02. Ask: 24,11. 26. 52W high: 26,89. 24. 52W low: 19,46. 22. Volume: 13.133.741. 20. Dividend: 5,12. 12/07. 02/08. 04/08. 06/08.

E N D
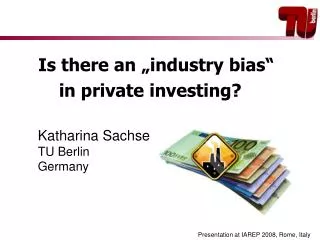
Is there an „industry bias“ in private investing? Katharina Sachse TU Berlin Germany Presentation at IAREP 2008, Rome, Italy
Stock XYZ Bid: 24,02 Ask: 24,11 26 52W high: 26,89 24 52W low: 19,46 22 Volume: 13.133.741 20 Dividend: 5,12 12/07 02/08 04/08 06/08 Introduction • According to traditional theories of finance the willingness to invest is determined by risk and return. • Other factors like e.g. the “home” of the company also affect investment decisions.
The Home Bias • Investors prefer domestic stocks against foreign stocks because they perceive themselves more knowledgeable about companies of their own country than about companies of foreign countries. • Ambiguity = the feeling of not knowing exactly • Ambiguity aversion: people avoid situations where they feel unknowledgeable
Stock Automobile Stock Biotech Bid: 24,02 Bid: 24,02 Ask: 24,11 Ask: 24,11 26 26 52W high: 26,89 52W high: 26,89 24 24 52W low: 19,46 52W low: 19,46 22 22 Volume: 13.133.741 Volume: 13.133.741 20 20 Dividend: 5,12 Dividend: 5,12 12/07 12/07 02/08 02/08 04/08 04/08 06/08 06/08 Is there also an industry bias? Maybe investors prefer stocks of companies producing well known commodities (e.g. automobiles) compared to stocks of companies producing unfamiliar commodities (e.g. biotechnology products).
Method Study 1 • 189 participants were asked to invest hypothetically in a given equity fund investing in a specific industry • We manipulated the ambiguity of the industry (independent variable): • Well known industry: media • Unfamiliar industry: construction • Industries were selected by a pretest. • We measured (dependent variables): • Knowledge about the industry group • Willingness to invest • Amount invested • Perceived risk of the fund
Results Study 1 • Correlations: • knowledge and willingness to invest: r=.08, N=189, p=.14 • knowledge and amount invested: r=-.02, N=69, p=.44 • knowledge and perceived risk: r=.21, N=184, p=.00 • Regression analysis (willingness to invest as criterion): • Nagelkerkes R²=.10, Beta knowledge=0.17 (df=1, p=.18), Beta risk=-0.48, (df=1, p=.00)
Discussion Study 1 • Ambiguity differences do not result in investment differences. • Possible explanations: • contradictory effects of knowledge and perceived risk • knowledge differences are too weak • comparative ignorance hypothesis (Fox & Tversky, 1995): ambiguity affects behavior only in situations, where ambiguous and non-ambiguous options are presented together • ambiguity really does not play a crucial role when investing in different industry groups
Image effects? • Some industries are perceived more positively than others. • People declare to be more willing to invest in industries with a good image than in industries with a bad image. (MacGregor, Slovic, Dreman & Berry, 2000) • Can investment choices be explained by the image of the industries?
Method Study 2 • 131 participants were asked to invest hypothetically in a given set of equity funds. • We varied the industry of the funds (independent variable): • Industries differed with regard to image. • Industries were selected by a pretest in which participants rated the image of several industry groups on a semantic differential. • We measured (dependent variables): • Image of the industry group • Amount invested • Perceived risk of the funds • Perceived return (probability and magnitude of possible gains)
Results study 2 • Correlations: • image and amount invested:r=.43, N=393, p=.00 • image and perceived risk: r=.02, N=393, p=.32 • image and probability of gain: r=.12, N=393, p=.02 • image and magnitude of gain: r=.07, N=393, p=.17 • Regression analysis (amount invested as criterion): corr. R²= .27 Beta image = .42 (p=.00) Beta risk = -.14 (p=.01) Beta probability of gain = .21 (p=.00) Beta magnitude of gain =-.12 (p=.01)
Discussion Study 2 • The investment decision seems to be substantially influenced by the image of the industry. • Willingness to invest can be predicted better by image than by risk- and return-features. • Critique: • Decisions did not have real monetary consequences. • Maybe participants were not motivated to evaluate complex financial information and relied on information that is easy to assess.
Questions for further research • Can image effects also be obtained in investment decisions with real monetary consequences? • How can private investors be encouraged to use risk and return information more appropriately? • Design of the decision situation • Motivation • Expertise/experience • Design of the information • Salience of risk and return-information
Theoretical note • Results can be explained by recent dual-process-models of decision making (Glöckner & Betsch, 2008, Kahneman & Frederick, 2001, Loewenstein, Weber, Hsee & Welch, 2001): • System 1 (The intuitive system): • Information processing is rapid, effortless, parallel, and tacit • Used information is salient, affective, easy to evaluate • System 2 (The deliberate system): • Information processing is slow, effortful, serial, and controlled • Used information is abstract, neutral, quantitative • Decision making always starts with system 1. Processing of system 2 is then influenced by the results of system 1 processes. • Qualitative information such as the image or the “home” of an investment option are more salient and easier to evaluate than quantitative risk-return-information and therefore more likely to affect investment decisions.
Pretest study 2 (semantic differential) Results of the pretest (N=36) Examples of the items: pleasant – unpleasant useful – useless exciting – boring stable – instable strong - weak Software Construction Defence Media Valence Leisure Tobacco Potency
References Ellsberg, D. (1961). Risk, ambiguity, and the Savage axioms. Quartely Journal of Economics, 75, 643-669. Fox, C.R. & Tversky, A. (1995). Ambiguity aversion and comparative ignorance. The Quarterly Journal of Economics, 110, 585-603. French, K.R. & Poterba, J.M. (1991). Investor diversification and international equity markets. American Economic Review, 81, 222-226. Glöckner, A. & Betsch, T. (2008). Modeling option and strategy choices with connectionist networks: Towards an integrative model of automatic and deliberate decision making. Judgment and Decision Making, 3, 215-228. Kahneman, D. & Frederick, S. (2002). Representativeness revisited: Attribute substitution in intuitive judgment. In: T. Gilovich, D. Griffin & D. Kahneman (eds.), Heuristics and Biases: The Psychology of Intuitive Judgment (pp. 49-81). New York: Cambridge University Press. Loewenstein, G., Weber, E.U., Hsee, C.K. & Welch, N. (2001). Risk as feelings. Psychological Bulletin, 127, 267-286. Sachse, K. (2008). Risiken der Kapitalanlage aus Sicht der Privatanleger [Investment Risk – The Perspective of Private Investors]. Dissertation, TU Berlin. Available online: http://opus.kobv.de/tuberlin/volltexte/2008/1922/