Download

1 / 22
290 likes | 684 Vues
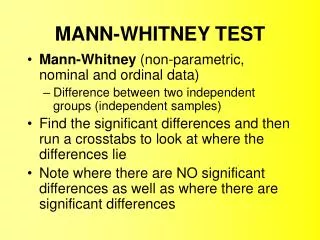
The Mann-Whitney U Test What you need to know. When Should I Use the Mann-Whitney U Test?. Non-parametric distribution Independent Measures Ratio or interval data, but must be reduced to ordinal data because it is non-parametric Different variances for two groups

E N D
When Should I Use the Mann-Whitney U Test? • Non-parametric distribution • Independent Measures • Ratio or interval data, but must be reduced to ordinal data because it is non-parametric • Different variances for two groups • It assumes Random assignments to groups • Test statistic: U
Mann-Whitney U Test • What is it for? A non-parametric test to compare the central tendencies of two groups • It assumes Random assignments to groups • Test statistic: U
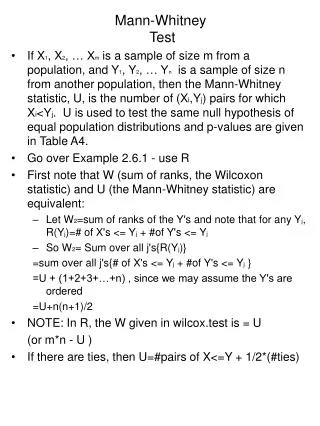
Mann-Whitney U test Null hypothesis The two groups Have the same median Sample Test statistic U1 or U2 Null distribution U with n1, n2 compare How unusual is this test statistic? P > 0.05 P < 0.05 Reject Ho Fail to reject Ho
Null Hypothesis • Involves the creation of two competing explanations for the data recorded. • Idea 1:These are pattern-less random data. Any observed patterns are due to chance. This is the null hypothesis H0 • Idea 2: There is a defined pattern in the data. This is the alternative hypothesis H1 • Without the statement of the competing hypotheses, no meaning test can be run.
Step One • Arrange all the observations into a single ranked series. That is, rank all the observations without regard to which sample they are in. • In other words, combine all of the data from both groups into a single column, in order, but keep track of what group they came from.
Mann-Whitney U Test • If you have ties: • Rank them anyway, pretending they were slightly different • Find the average of the ranks for the identical values, and give them all that rank • Carry on as if all the whole-number ranks have been used up
Example Data 14 2 5 4 2 14 18 14
Example Sorted Data Data 14 2 5 4 2 14 18 14 2 G12 G2 4 G2 5 G1 14 G1 14 G2 14 G1 18 G2
Example Sorted Data Data 14 2 5 4 2 14 18 14 2 G12 G2 4 G2 5 G1 14 G1 14 G2 14 G1 18 G2 TIES
Example Sorted Data Data Rank them anyway, pretending they were slightly different 14 2 5 4 2 14 18 14 2 G12 G2 4 G2 5 G1 14 G1 14 G2 14 G1 18 G2 TIES
Example Sorted Data Data Rank A 14 2 5 4 2 14 18 14 2 G12 G2 4 G2 5 G1 14 G1 14 G2 14 G1 18 G2 12 3 4 5 6 7 8
Example Sorted Data Data Rank A Find the average of the ranks for the identical values, and give them all that rank 14 2 5 4 2 14 18 14 2 G12 G2 4 G2 5 G1 14 G1 14 G2 14 G1 18 G2 12 3 4 5 6 7 8
Example Sorted Data Data Rank A Average = 1.5 14 2 5 4 2 14 18 14 2 G12 G2 4 G2 5 G1 14 G1 14 G2 14 G1 18 G2 12 3 4 5 6 7 8 Average = 6
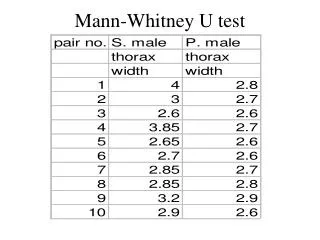
Example Sorted Data Data Rank A Rank 14 2 5 4 2 14 18 14 2 G12 G2 4 G2 5 G1 14 G1 14 G2 14 G1 18 G2 12 3 4 5 6 7 8 1.51.5 3 4 6 6 6 8
Example Sorted Data Data Rank A Rank 14 2 5 4 2 14 18 14 2 G12 G2 4 G2 5 G1 14 G1 14 G2 14 G1 18 G2 12 3 4 5 6 7 8 1.51.5 3 4 6 6 6 8 First, sort them back into the two groups, Then these can now be used for the Mann-Whitney U test
Step Two • Add up the ranks for the observations which came from sample 1(the smaller group, fewer participants). • Then add up the sum of ranks in sample 2 (Larger group)
Step Three • U is then given by: where n1 is the sample size for sample 1(smaller group), and R1 is the sum of the ranks in sample 1
Step Five • The smaller value of U1 and U2 is the one used when consulting significance tables.
Compare • If the smaller value of U1 or U2 is smaller than the critical value in the chart, then the probability that the differences in the groups is obtained by chance is less than 0.05, and you may reject the null hypothesis.