Download
1 / 84
850 likes | 1.06k Vues
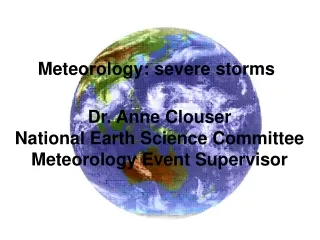
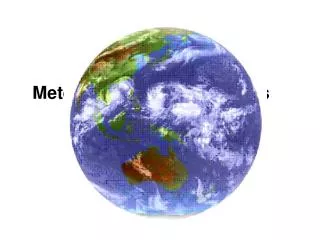
Meteorology: severe storms. Meteorology: Severe Storms. Severe Weather: is the second topic in the B-Division Science Olympiad Meteorology Event.

E N D
Meteorology: Severe Storms • Severe Weather: is the second topic in the B-Division Science Olympiad Meteorology Event. • Topics: rotate annually so a middle school participant may receive a comprehensive course of instruction in meteorology during the three-year cycle. • Sequence: • Everyday Weather (2010) • Severe Storms (2008) • Climate (2009)
topics to be covered • General knowledge of basic weather including: the composition and structure of the atmosphere,air masses, fronts, highs and lows, cyclones, anticyclones, weather maps, weather stations, surface weather maps, meteograms, and isopleths. • Modern weather technology: satellite imagery and doppler imagery. • Global circulation patterns: easterlies, westerlies, polar front, etc. • Thunderstorms: all types • Tornados • Mid-latitude Cyclones • Hurricanes • Saffir-simpson, Fujita & E-scales • Lightning (including sprites and jets), hail and other associated storm hazards • Common storm tracks across the continental United States
General knowledge – composition and structure of the atmosphere • ITS COMPOSITION • There are permanent gasses (nitrogen and oxygen) • There are variable gasses (carbon dioxide, methane, water vapor, ozone, particulates • The composition of the atmosphere has not been constant but has changed through time. • We used to be the stuff of stars (helium and hydrogen) but outgassing, comets, UV radiation and photosynthesis have changed us. • http://www.uwsp.edu/gEo/faculty/ritter/geog101/textbook/atmosphere/atmospheric_structure.html • http://www.physicalgeography.net/fundamentals/7a.html • http://www.visionlearning.com/library/module_viewer.php?mid=107&l=&c3= • http://www.globalchange.umich.edu/globalchange1/current/lectures/samson/evolution_atm/index.html#evolution
General knowledge – composition and structure of the atmosphere • IT’S STRUCTURE • Layers are defined by temperature, altitude, and unique characteristics • There are layers where temperature rises with altitude or falls with altitude (our natural instinct). • Between these layers there are pauses where temperature is constant with altitude change. • Each layer has unique characteristics like 90% of the ozone is in the stratosphere and gasses stratify by molecular weight in the thermosphere • Thickness of these layers varies with latitude. • http://www.uwsp.edu/gEo/faculty/ritter/geog101/textbook/atmosphere/atmospheric_structure.html • http://www.albany.edu/faculty/rgk/atm101/structur.htm
General knowledge – air masses • Air masses tend to be homogeneous in nature. The two critical properties of any air mass are: • 1. Temperature • 2. Moisture • The point of origin of an air mass will determine temperature and moisture content. Combined these properties produce the weather we experience daily. • http://www.ecn.ac.uk/Education/air_masses.htm • http://okfirst.ocs.ou.edu/train/meteorology/AirMasses.html
General knowledge – air masses • An air mass is a huge volume of air that covers hundreds of thousands of square kilometers that is relatively uniform horizontally and vertically in both temperature and humidity • The characteristics of an air mass are determined by the surface over which they form so they are either continental or maritime indicated with a lower case m or c • Then they are classed as Arctic, Polar, Tropical or Equitorial (A, P, T, or E) • And finally they have a lower case k or w at the end to indicate whether they are warmer or colder than the land over which they are moving. • Note that arctic and polar are difficult to distinguish as are tropical and equatorial. • Air masses are driven by the prevailing winds. Hot air originates near the equator and cold near the poles and the middle latitudes where we live is the mixing zone and we have spectacular weather as warm and cold air masses work their way across us.
General knowledge highs, lows, and fronts High pressure system is an anticyclone Highs generally have good weather and when seen from above surface winds surrounding a high blow in a clockwise direction and outward from the high Lows and highs track with the prevailing winds from west to east across the US Low pressure system is a cyclone Lows tend to have cloudy bad weather and when seen from above surface winds surrounding a low blow in a counter clockwise direction and inward to the low. Lows and highs track with the prevailing winds from west to east across the US
General knowledge highs, lows, and fronts • As air masses collide carrying their characteristic temperature and moisture they create fronts: warm, cold, stationary and occluded. • Each type of front has unique vertical characteristics with characteristic weather patterns.
General knowledge - warmfronts • Warm fronts tend to move slowly • They carry broad bands of clouds that begin high and drop lower with time. • They tend to be associated with light and prolonged rains and warming temperatures • A warm front is defined as the transition zone where a warm air mass is replacing a cold air mass. Warm fronts generally move from southwest to northeast and the air behind a warm front is warmer and more moist than the air ahead of it. When a warm front passes through, the air becomes noticeably warmer and more humid than it was before. • Symbolically, a warm front is represented by a solid line with semicircles pointing towards the colder air and in the direction of movement.
General knowledge - cold fronts • A cold front is defined as the transition zone where a cold air mass is replacing a warmer air mass. Cold fronts generally move from northwest to southeast. The air behind a cold front is noticeably colder and drier than the air ahead of it. When a cold front passes through, temperatures can drop more than 15 degrees within the first hour. • Cold fronts tend to be associated with vertical clouds and rains of short duration but often with intensity. • There is typically a noticeable temperature change from one side of a cold front to the other. In the map of surface temperatures right, the station east of the front reported a temperature of 55 degrees Fahrenheit while a short distance behind the front, the temperature decreased to 38 degrees. An abrupt temperature change over a short distance is a good indicator that a front is located somewhere in between. • Symbolically, a cold front is represented by a solid line with triangles along the front pointing towards the warmer air and in the direction of movement. On colored weather maps, a cold front is drawn with a solid blue line.
General knowledge - Stationary fronts • When a warm or cold front stops moving, it becomes a stationary front. Once this boundary resumes its forward motion, it once again becomes a warm front or cold front. A stationary front is represented by alternating blue and red lines with blue triangles pointing towards the warmer air and red semicircles pointing towards the colder air. • A noticeable temperature change and/or shift in wind direction is commonly observed when crossing from one side of a stationary front to the other.
General Knowledge - Occluded fronts • A developing cyclone typically has a preceding warm front (the leading edge of a warm moist air mass) and a faster moving cold front (the leading edge of a colder drier air mass wrapping around the storm). North of the warm front is a mass of cooler air that was in place before the storm even entered the region. • As the storm intensifies, the cold front rotates around the storm and catches the warm front. This forms an occluded front, which is the boundary that separates the new cold air mass (to the west) from the older cool air mass already in place north of the warm front. • Symbolically, an occluded front is represented by a solid line with alternating triangles and circles pointing the direction the front is moving. On colored weather maps, an occluded front is drawn with a solid purple line. • Changes in temperature, dew point temperature, and wind direction can occur with the passage of an occluded front. • A noticeable wind shift also occurred across the occluded front. East of the front, winds were reported from the east-southeast while behind the front, winds were from the west-southwest.
General knowledge - Warm or cold occluded fronts Cold occlusion A colder air mass advances on a cold air mass and occludes warmer air. Warm occlusion A warmer air mass advances on a cold air mass and occludes warmer air.
surface weather stations: current conditions • A weather symbol is plotted if at the time of observation, there is either precipitation occurring or a condition causing reduced visibility. Below is a list of the most common weather symbols:
surface weather stations: wind speed and direction • Wind is plotted in increments of 5 knots (kts), with the outer end of the symbol pointing toward the direction from which the wind is blowing. • The wind speed is determined by adding up the total of flags, lines, and half-lines, each of which have the following individual values: flag: 50 kts, Line: 10 kts, Half-Line: 5 kts. • Wind is always reported as the direction from which it is coming. • If there is only a circle depicted over the station with no wind symbol present, the wind is calm. Below are some sample wind symbols:
surface weather stations: pressure and trend • PRESSURESea-level pressure is plotted in tenths of millibars (mb), with the leading 10 or 9 omitted. For reference, 1013 mb is equivalent to 29.92 inches of mercury. Below are some sample conversions between plotted and complete sea-level pressure values. If the surface weather station number is <500 place a leading 10 if it is >500 place a leading 9; then divide by 10:410: 1041.0 mb103: 1010.3 mb987: 998.7 mb872: 987.2 mb http://www.csgnetwork.com/meteorologyconvtbl.html • http://ww2010.atmos.uiuc.edu/(Gh)/guides/maps/sfcobs/home.rxml • PRESSURE TRENDThe pressure trend has two components, a number and symbol, to indicate how the sea-level pressure has changed during the past three hours. The number provides the 3-hour change in tenths of millibars, while the symbol provides a graphic illustration of how this change occurred. Below are the meanings of the pressure trend symbols:
surface weather stations: sky cover • The amount that the circle at the center of the station plot is filled in reflects the approximate amount that the sky is covered with clouds. To the right are the common cloud cover depictions
General knowledge - weather mapsradar, fronts, isopleths and data • There is a tremendous amount of information on maps like these and they make excellent material for test questions. For instance, what type of front is about to enter the state of Arkansas? What is the current wind direction and speed for the surface weather station in central New Mexico? Students need to know their state maps!
General knowledge - meteograms • Meteograms give vast amounts of information about a given areas weather over a 24 hour period. Great thinking questions can be drawn from this material
modern weather technologysatellites and radar imagery • With the advent of satellites and radar vast amounts of weather data may be observed . . . It is learning what it all means and what it can do for us that is important. • Lets look at some of the types of data collected by these satellites. • These types of images are great ways to view severe storms
weather technology: infrared imagery • These images come from satellites which remain above a fixed point on the Earth (i.e. they are "geostationary"). The infrared image shows the invisible infrared radiation emitted directly by cloud tops and land or ocean surfaces. The warmer an object is, the more intensely it emits radiation, thus allowing us to determine its temperature. These intensities can be converted into grayscale tones, with cooler temperatures showing as lighter tones and warmer as darker. • Lighter areas of cloud show where the cloud tops are cooler and therefore where weather features like fronts and shower clouds are. The advantage of infrared images is that they can be recorded 24 hours a day. However low clouds, having similar temperatures to the underlying surface, are less easily discernable. Coast-lines and lines of latitude and longitude have been added to the images and they have been altered to northern polar stereographic projection. • The infrared images are updated every hour. It usually takes about 20 minutes for these images to be processed and be updated on the website. The time shown on the image is in UTC.
modern weather technologywater vapor imagery • These images come from satellites which remain above a fixed point on the Earth (geostationary). The image shows the water vapor in the atmosphere and is quite different from the visible or the infrared image. • The are updated every hour.
modern weather technology visible light imagery • These images come from satellites which remain above a fixed point on the Earth (geostationary). The visible image record visible light from the sun reflected back to the satellite by cloud tops and land and sea surfaces. They are equivalent to a black and white photograph from space. They are better able to show low cloud than infrared images. However, visible pictures can only be made during daylight hours. The visible images are updated hourly and the time shown on the image is in UTC.
Doppler weather radar – what it shows • All weather radars send out radio waves from an antenna. Objects in the air, such as raindrops, snow crystals, hailstones or even insects and dust, scatter or reflect some of the radio waves back to the antenna. All weather radars, including Doppler, electronically convert the reflected radio waves into pictures showing the location and intensity of precipitation. • Doppler radars also measure the frequency change in returning radio waves. • Waves reflected by something moving away from the antenna change to a lower frequency, while waves from an object moving toward the antenna change to a higher frequency. • The computer that's a part of a Doppler radar uses the frequency changes to show directions and speeds of the winds blowing around the raindrops, insects and other objects that reflected the radio waves. • Scientists and forecasters have learned how to use these pictures of wind motions in storms, or even in clear air, to more clearly understand what's happening now and what's likely to happen in the next hour or two.
Doppler weather radar – what it shows • Precipitation Intensity levels • Radar images are color-coded to indicate precipitation intensity. The scale below is used on radar mages. The light blue color is the lightest precipitation and the purple and white are the heaviest. Sometimes radar images indicate virga, or precipitation that isn't reaching the ground. • Precipitation type • Reflectivity not only depends on precipitation intensity, but also the type of precipitation. Hail and sleet are made of ice and their surfaces easily reflect radio energy. This can cause light sleet to appear heavy. Snow, on the other hand, can scatter the beam, causing moderate to heavy snow to appear light.
Doppler weather radar – what it shows Hook echo These are commonly found in a single thunderstorm, in which the reflectivity image resembles a hook. When this occurs, the thunderstorm is producing a circulation and possibly a tornado. The rain gets wrapped around this circulation in the shape of a hook. In this image, a thunderstorm with a hook echo moves across central Oklahoma May 3, 1999. Squall line thunderstorms An organized line of thunderstorms is known as squall line. These are common during the spring and are usually triggered along cold fronts. In this picture, a squall line slices across southern Ohio ahead of a cold front.
Doppler weather radar – what it shows • Tornado vortex signature • Doppler radar can tell when a thunderstorm has Tornado Vortex Signature (TVS). This indicates where wind directions are changing — known as shear —- within a small area and there is rotation. There is also a strong possibility that a tornado will form in that area. A National Weather Service forecaster could issue a tornado warning based on this radar signature.
Doppler weather radar – what it shows Bow echoes Bow echoes are clusters of thunderstorms that resemble a bow, where the center of the line extends past the two ends of the line. This bow shape is a result of strong winds in the upper levels of the atmosphere that often mix down to the surface.
In the three cell model, the equator is the warmest location on the Earth and acts as a zone of thermal lows known as the intertropical convergence zone(ITCZ). The ITCZ draws in surface air from the subtropics and as it reaches the equator, it rises into the upper atmosphere by convergence and convection. It attains a maximum vertical altitude of about 14 kilometers (top of the troposphere), then begins flowing horizontally to the North and South Poles. Coriolis force causes the deflection of this moving air, and by about 30° of latitude the air begins to flow zonally from west to east. GLOBAL ATMOSPHERIC CIRCULATION: PLANETARY WINDS AND CORIOLIS
This zonal flow is known as the subtropical. The zonal flow also causes the accumulation of air in the upper atmosphere as it is no longer flowing meridionally. To compensate for this accumulation, some of the air in the upper atmosphere sinks back to the surface creating the subtropical high pressure zone. From this zone, the surface air travels in two directions. A portion of the air moves back toward the equator completing the circulation system known as the Hadley cell. This moving air is also deflected by the Coriolis effect to create the Northeast Trades (right deflection) and Southeast Trades (left deflection). GLOBAL ATMOSPHERIC CIRCULATION: PLANETARY WINDS AND CORIOLIS
The surface air moving towards the poles from the subtropical high zone is also deflected by Coriolis acceleration producing the Westerlies. Between the latitudes of 30 to 60° North and South, upper air winds blow generally towards the poles. Once again, Coriolis force deflects this wind to cause it to flow west to east forming the polar jet stream at roughly 60° North and South. On the Earth's surface at 60° North and South latitude, the subtropical Westerlies collide with cold air traveling from the poles. This collision results in frontal uplift and the creation of the subpolar lows or mid latitude cyclones. A small portion of this lifted air is sent back into theFerrel Cell after it reaches the top of the troposphere. Most of this lifted air is directed to the polar vortex where it moves downward to create the polar high. http://www.physicalgeography.net/fundamentals/7p.html ATMOSPHERIC CIRCULATION: PLANETARY WINDS AND CORIOLIS
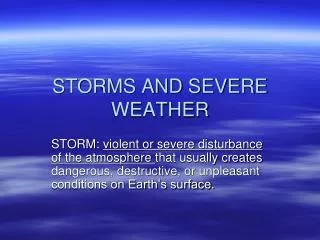
It is late afternoon. The white puffy clouds that have been growing all day are replaced by a greenish sky. A distant rumble is heard...then another. It starts to rain. A flash of light streaks the sky, followed by a huge BOOM. Welcome to a thunderstorm. Thunderstorms are one of the most thrilling and dangerous of weather phenomena. Over 40,000 thunderstorms occur throughout the world each day. Thunderstorms have several distinguishing characteristics that can cause large amounts of damage to humans and their property. Straight-line winds and tornadoes can uproot trees and demolish buildings. Hail can damage cars and crops. Heavy rains can create flash floods. Lightning can spark a forest fire or hurt you. safety during a thunderstorm is really important. THUNDERSTORMShttp://www.windows.ucar.edu/tour/link=/earth/Atmosphere/tstorm.html
THUNDERSTORMS – FORMATION • The initial stage of development is called the cumulus stage. During this stage warm, moist, and unstable air is lifted from the surface. In the case of an air mass thunderstorm, the uplift mechanism is convection. As the air ascends, it cools and upon reaching its dew point temperature begins to condense into a cumulus cloud. Near the end of this stage precipitation forms. • http://www.uwsp.edu/geo/faculty/ritter/geog101/textbook/weather_systems/severe_weather_thunderstorms.html
THUNDERSTORMS – FORMATION • The second stage is the mature stage of development. During the mature stage warm, moist updrafts continue to feed the thunderstorm while cold downdrafts begin to form. The downdrafts are a product of the entrainment of cool, dry air into the cloud by the falling rain. As rain falls through the air it drags the cool, dry air that surrounds the cloud into it. As dry air comes in contact with cloud and rain droplets they evaporate cooling the cloud. The falling rain drags this cool air to the surface as a cold downdraft. In severe thunderstorms the region of cold downdrafts is separate from that of warm updrafts feeding the storm. As the downdraft hits the surface it pushes out ahead of the storm. Sometimes you can feel the downdraft shortly before the thunderstorm reaches your location as a cool blast of air. • http://www.nssl.noaa.gov/primer/tstorm/tst_basics.html
THUNDERSTORMS - FORMATION • The final stage is the dissipating stage when the thunderstorm dissolves away. By this point, the entrainment of cool air into the cloud helps stabilize the air. In the case of the air mass thunderstorm, the surface no longer provides enough convective uplift to continue fueling the storm. As a result, the warm updrafts have ceased and only the cool downdrafts are present. The downdrafts end as the rain ceases and soon the thunderstorm dissipates. http://www.nssl.noaa.gov/primer/tstorm/tst_climatology.html
THE SINGLE CELL STORM – air mass thunder storm • Single cell thunderstorms usually last between 20-30 minutes. A true single cell storm is actually quite rare because often the gust front of one cell triggers the growth of another. • Most single cell storms are not usually severe. However, it is possible for a single cell storm to produce a brief severe weather event. When this happens, it is called a pulse severe storm. Their updrafts and downdrafts are slightly stronger, and typically produce hail that barely reaches severe limits and/or brief microbursts (a strong downdraft of air that hits the ground and spreads out). Brief heavy rainfall and occasionally a weak tornado are possible. Though pulse severe storms tend to form in more unstable environments than a non-severe single cell storm, they are usually poorly organized and seem to occur at random times and locations, making them difficult to forecast.
THE MULTI-CELL CLUSTER STORM • The multicell cluster is the most common type of thunderstorm. The multicell cluster consists of a group of cells, moving along as one unit, with each cell in a different phase of the thunderstorm life cycle. Mature cells are usually found at the center of the cluster with dissipating cells at the downwind edge of the cluster. • Multicell Cluster storms can produce moderate size hail, flash floods and weak tornadoes. • Each cell in a multicell cluster lasts only about 20 minutes; the multicell cluster itself may persist for several hours. This type of storm is usually more intense than a single cell storm, but is much weaker than a supercell storm. • http://www.mcwar.org/articles/types/tstorm_types.html
MULTICELL LINE STORM - SQUALL LINE • The multicell line storm, or squall line, consists of a long line of storms with a continuous well-developed gust front at the leading edge of the line. The line of storms can be solid, or there can be gaps and breaks in the line. • Squall lines can produce hail up to golf-ball size, heavy rainfall, and weak tornadoes, but they are best known as the producers of strong downdrafts. Occasionally, a strong downburst will accelerate a portion of the squall line ahead of the rest of the line. This produces what is called a bow echo. Bow echoes can develop with isolated cells as well as squall lines. Bow echoes are easily detected on radar but are difficult to observe visually.
THE SUPERCELL STORM • The supercell is a highly organized thunderstorm. Supercells are rare, but pose a high threat to life and property. A supercell is similar to the single-cell storm because they both have one main updraft. The difference in the updraft of a supercell is that the updraft is extremely strong, reaching estimated speeds of 150-175 miles per hour. The main characteristic which sets the supercell apart from the other thunderstorm types is the presence of rotation. The rotating updraft of a supercell (called a mesocyclone when visible on radar) helps the supercell to produce extreme severe weather events, such as giant hail (more than 2 inches in diameter, strong downbursts of 80 miles an hour or more, and strong to violent tornadoes. • The surrounding environment is a big factor in the organization of a supercell. Winds are coming from different directions to cause the rotation. And, as precipitation is produced in the updraft, the strong upper-level winds blow the precipitation downwind. Hardly any precipitation falls back down through the updraft, so the storm can survive for long periods of time. • The leading edge of the precipitation from a supercell is usually light rain. Heavier rain falls closer to the updraft with torrential rain and/or large hail immediately north and east of the main updraft. The area near the main updraft (typically towards the rear of the storm) is the preferred area for severe weather formation.
Lightninghttp://thunder.msfc.nasa.gov/primer/http://science.howstuffworks.com/lightning.htmLightninghttp://thunder.msfc.nasa.gov/primer/http://science.howstuffworks.com/lightning.htm • Lightning is one of the most beautiful displays in nature. It is also one of the most deadly natural phenomena known to man. With bolt temperatures hotter than the surface of the sun and shockwaves beaming out in all directions, lightning is a lesson in physical science and humility.